Overview
The Cloud Native community has been incredibly busy since our last set of scaling tests on the CNCF cluster back in August. In particular, the Kubernetes (and by extension, OpenShift) communities have been hard at work pushing scalability to entirely new levels. As a significant contributor to Kubernetes, Red Hat engineers are involved in this process both upstream and with our enterprise distribution of Kubernetes, Red Hat OpenShift Container Platform.
It’s time to put the new OpenShift 3.5 release to the test again with more benchmarking on the CNCF community cluster that has been donated and built out by Intel.
For more information about what Red Hat is doing in the Kubernetes community, be sure to attend our talks At CloudNativeCon + KubeCon Europe this week:
- Keynote: Red Hat is Driving Kubernetes/Container Security Forward
- The Open Service Broker API and the Kubernetes Service Catalog
Recap
The previous round of benchmarking on CNCF’s cluster provided us with a wealth of information, which greatly aided our work on this new release. The last series of scaling tests on the CNCF cluster consisted of using a cluster-loader utility (as demonstrated at CloudNativeCon + KubeCon in Seattle last year) to load the environment with realistic content such as Django/Wordpress, along with multi-tier apps that included databases such as PostgreSQL and MariaDB. We did this on Red Hat OpenShift Container Platform running on a 1,000 node cluster provisioned and managed using Red Hat OpenStack Platform. We scaled the number of applications up, analyzed the state of the system while under load and folded all of the lessons learned into Kubernetes and then downstream into OpenShift.
What we built on the CNCF Cluster
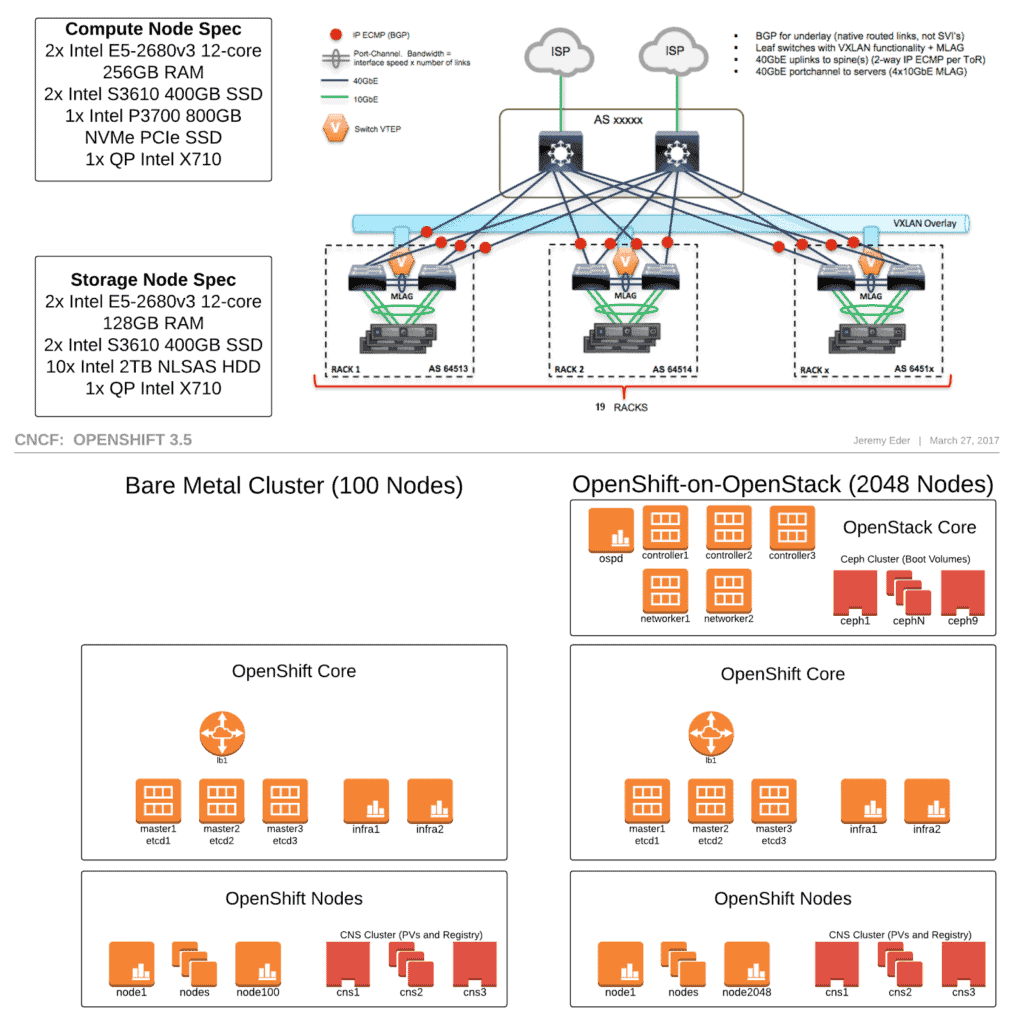
This time we wanted to leverage bare metal as well. So we built two OpenShift clusters: one cluster of 100 nodes on bare metal and another cluster of 2,048 VM nodes on Red Hat OpenStack Platform 10. We chose 2,048 because it’s a power of 2, and that makes engineers happy.

Goals
We kept some of our goals from last time, and added some cool new ones:
- 2,000+ node OpenShift Cluster and research future reference designs
- Use Overlay2 graph driver for improved density & performance, along with recent SELinux support added in kernel v4.9
- Saturation test for OpenShift’s HAProxy-based network ingress tier
- Persistent volume scalability and performance using Red Hat’s Container-Native Storage (CNS) product
- Saturation test for OpenShift’s integrated container registry and CI/CD pipeline
Network Ingress/Routing Tier
The routing tier in OpenShift consists of machine(s) running HAProxy as the ingress point into the cluster. As our tests verified, HAProxy is one of the most performant open source solutions for load balancing. In fact, we had to re-work our load generators several times in order to push HAProxy as required. By super popular demand from our customers, we also added SNI and TLS variants to our test suite.
Our load generator runs in a pod and its configuration is passed in via configmaps. It queries the Kubernetes API for a list of routes and builds its list of test targets dynamically.
Here is an example of the configuration that our load generator uses:

In our scenario, we found that HAProxy was indeed exceptionally performant. From field conversations, we identified a trend that there are (on average) a large number of low-throughput cluster ingress connections from clients (i.e. web browsers) to HAProxy versus a small number of high-throughput connections. Taking this feedback into account, the default connection limit of 2,000 leaves plenty of room on commonly available CPU cores for additional connections. Thus, we have bumped the default connection limit to 20,000 in OpenShift 3.5 out of the box.
If you have other needs to customize the configuration for HAProxy, our networking folks have made it significantly easier — as of OpenShift 3.4, the router pod now uses a configmap, making tweaks to the config that much simpler.
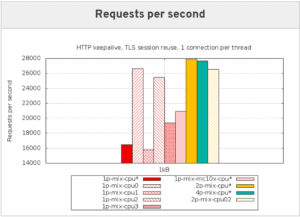
As we were pushing HAProxy we decided to zoom in on a particularly representative workload mix – a combination of HTTP with keepalive and TLS terminated at the edge. We chose this because it represents how most OpenShift production deployments are used – serving large numbers of web applications for internal and external use, with a range of security postures.
Let’s take a closer look of this data, noting that since this is a throughput test with a Y-axis of Requests Per Second, higher is better.
nbproc is the number of HAProxy processes spawned. nbproc=1 is currently the only supported value in OpenShift, but we wanted to see what if anything increasing nbproc bought us from a performance and scalability standpoint.
Each bar represents a different potential tweak:
- 1p-mix-cpu*: HAProxy nbproc=1, run on any CPU
- 1p-mix-cpu0: HAProxy nbproc=1, run on core 0
- 1p-mix-cpu1: HAProxy nbproc=1, run on core 1
- 1p-mix-cpu2: HAProxy nbproc=1, run on core 2
- 1p-mix-cpu3: HAProxy nbproc=1, run on core 3
- 1p-mix-mc10x: HAProxy nbproc=1, run on any core, sched_migration_cost=5000000
- 2p-mix-cpu*: HAProxy nbproc=2, run on any core
- 4p-mix-cpu02: HAProxy nbproc=4, run on core 2

We can learn a lot from this single graph:
- CPU affinity matters. But why are certain cores nearly 2x faster? This is because HAProxy is now hitting the CPU cache more often due to NUMA/PCI locality with the network adapter.
- Increasing nbproc helps throughput. nbproc=2 is ~2x faster than nbproc=1, BUT we get no more boost from going to 4 cores, and, in fact, nbproc=4 is slower than nbproc=2. This is because there were 4 cores in this guest, and 4 busy HAProxy threads left no room for the OS to do its thing (like process interrupts).
In summary, we know that we can improve performance more than 20 percent from baseline with no changes other than sched_migration_cost. What is that knob? It is a kernel tunable that weights processes when deciding if/how the kernel should load balance them amongst available cores. By increasing it by a factor of 10, we keep HAProxy on the CPU longer, and increase our likelihood of CPU cache hits by doing so.
This is a common technique amongst the low-latency networking crowd, and is in fact recommended tuning in our Low Latency Performance Tuning Guide for RHEL7.
We’re excited about this one, and will endeavor to bring this optimization to an OpenShift install near you :-).
Look for more of this sort of tuning to be added to the product as we’re constantly hunting opportunities.
Network Performance
In addition to providing a routing tier, OpenShift also provides an SDN. Similar to many other container fabrics, OpenShift-SDN is based on OpenvSwitch+VXLAN. OpenShift-SDN defaults to multitenant security as well, which is a requirement in many environments.
VXLAN is a standard overlay network technology. Packets of any protocol on the SDN are wrapped in UDP packets, making the SDN capable of running on any public or private cloud (as well as bare metal).
Incidentally, both the ingress/routing and SDN tier of OpenShift are pluggable, so you can swap those out for vendors who have certified compatibility with OpenShift.
When using overlay networks, the encapsulation technology comes at a cost of CPU cycles to wrap/unwrap packets and is mostly visible in throughput tests. VXLAN processing can be offloaded to many common network adapters, such as the ones in the CNCF Cluster.
Web-based workloads are mostly transactional, so the most valid microbenchmark is a ping-pong test of varying payload sizes.
Below you can see a comparison of various payload sizes and stream count. We use a mix like this as a slimmed down version of RFC2544.
- tcp_rr-64B-1i: tcp, round-robin, 64byte payload, 1 instance (stream)
- tcp_rr-64B-4i: tcp, round-robin, 64byte payload, 4 instances (streams)
- tcp_rr-1024B-1i: tcp, round-robin, 1024byte payload, 1 instance (stream)
- tcp_rr-1024B-4i: tcp, round-robin, 1024byte payload, 4 instance (streams)
- tcp_rr-16384B-1i: tcp, round-robin, 16384byte payload, 1 instance (stream)
- tcp_rr-16384B-4i: tcp, round-robin, 16384byte payload, 4 instance (streams)
The X-axis is number of transactions per second. For example, if the test can do 10,000 transactions per second, that means the round-trip latency is 100 microseconds. Most studies indicate the human eye can begin to detect variations in page load latencies in the range of 100-200ms. We’re well within that range.

Bonus network tuning: large clusters with more than 1,000 routes or nodes require increasing the default kernel arp cache size. We’ve increased it by a factor of 8x, and are including that tuning out of the box in OpenShift 3.5.
Overlay2, SELinux
Since Red Hat began looking into Docker several years ago, our products have defaulted to using Device Mapper for Docker’s storage graph driver. The reasons for this are maturity, supportability, security, and POSIX compliance. Since the release of RHEL 7.2 in early 2016, Red Hat has also supported the use of overlay as the graph driver for Docker.
Red Hat engineers have since added SELinux support for overlay to the upstream kernel as of Linux 4.9. These changes were backported to RHEL7, and will show up in RHEL 7.4. This set of tests on the CNCF Cluster used a candidate build of the RHEL7.4 kernel so that we could use overlay2 backend with SELinux support, at scale, under load, with a variety of applications.
Red Hat’s posture toward storage drivers has been to ensure that we have the right engineering talent in-house to provide industry-leading quality and support. After pushing overlay into the upstream kernel, as well as extending support for SELinux, we feel that the correct approach for customers is to keep Device Mapper as the default in RHEL, while moving to change the default graph driver to overlay2 in Fedora 26. The first Alpha of Fedora 26 will show up sometime next month.
As of RHEL 7.3, we also have support for the overlay2 backend. The overlay filesystem has several advantages over device mapper (most importantly, page cache sharing among containers). Support for the overlay filesystem was added to RHEL with salient caveats such as that it is not POSIX compliant, and that use of overlay was, at the time, incompatible with SELinux (a key security/isolation technology).
That said, the density improvements gained by page cache sharing are very important for certain environments where there is significant overlap in base image content.
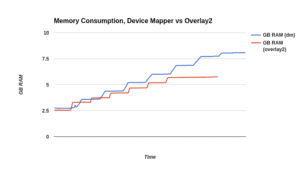
We constructed a test that used a single base image for all pods, and created 240 pods on a node. The cluster-loader utility used to drive this test has a feature called a “tuningset” which we use to control the rate of creation of pods. You can see there are 6 bumps in each line. Each of those represents a batch of 40 pods that cluster-loader created. Before it moves to the next batch, cluster-loader makes sure the previous batch is in running state. In this way, we? avoid crushing the API server with requests, and can examine the system’s profiles at each plateau.
Below are the differences between device mapper and overlay for memory consumption. The savings in terms of memory is reasonable (again, this is a “perfect world” scenario and your mileage may vary).

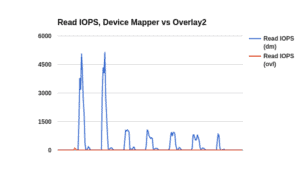
The reduction in disk operations below is due to subsequent container starts leveraging the kernel’s page cache rather than having to repeatedly fetch base image content from storage:

We have found overlay2 to be very stable, and it becomes even more interesting with the addition of SELinux support.
Container Native Storage
In the early days of Kubernetes, the community identified the need for stateful containers. To that end, Red Hat has contributed significantly to the development of persistent volume support in Kubernetes.
Depending on the infrastructure you’re on, Kubernetes and OpenShift support dozens of volume providers. Fiber Channel, iSCSI, NFS, Gluster, Ceph as well as cloud-specific storage providers such as Amazon EBS, Google persistent disks, Azure blob and OpenStack Cinder. Pretty much anywhere you want to run, OpenShift can bring persistent storage to your pods.
Red Hat Container Native Storage is a Gluster-based persistent volume provider that runs on top of OpenShift in a hyper-converged manner. That is, it is deployed in pods, scheduled like any other application running on OpenShift. We used the NVME disks in the CNCF nodes as “bricks” for gluster to use, out of which CNS provided 1GB secure volumes to each pod running on OpenShift using “dynamic provisioning.”
If you look closely at our deployment architecture, while we have deployed CNS on top of OpenShift, we also labeled those nodes as “unschedulable” from the OpenShift standpoint, so that no other pods would run on the same node. This helps control variability — reliable, reproducible data makes performance engineers happy :-).
We know that cloud providers limit volumes attached to each instance in the 16-128 range (often it is a sliding scale based on CPU core count). The prevailing notion seems to be that field implementations will see numbers in the range of 5-10 per node, particularly since (based on your workload) you may hit CPU/memory/IOPS limits long before you hit PV limits.
In our scenario we wanted to verify that CNS could allocate and bind persistent volumes at a consistent rate over time, and that the API control plane for CNS called Heketi can withstand an API load test. We ran throughput numbers for create/delete operations, as well as API parallelism.
The graph below indicates that CNS can allocate volumes in constant time – roughly 6 seconds from submit to the PVC going into “Bound” state. This number does not vary when CNS is deployed on bare metal or virtualized. Not pictured here are our tests verifying that several other persistent volume providers respond in a very similar timeframe.

OpenStack and Ceph
As we had approximately 300 physical machines for this set of tests, and goals of hitting the “engineering feng shui” value of 2,048 nodes, we first had to deploy Red Hat OpenStack Platform 10, and then build the second OpenShift environment on top. Unique to this deployment of OpenStack was:
- We used the new Composable roles feature to deploy OpenStack
- 3 Controllers
- 2 Networker nodes
- A bare metal role for OpenShift
- Multiple Heat stacks
- Bare metal Stack
- OpenStack Stack
- Ceph was also deployed through Director. Ceph’s role in this environment is to provide boot-from-volume service for our VMs (via Cinder).
We deployed a 9-node Ceph cluster on the CNCF “Storage” nodes, which include (2) SSDs and (10) nearline SAS disks. We know from our counterparts in the Ceph team that Ceph performs significantly better when deployed with write-journals on SSDs. Based on the CNCF storage node hardware, that meant creating two write-journals on the SSDs and allocating 5 of the spinning disks to each SSD. In all, we had 90 Ceph OSDs, equating to 158TB of available disk space.
From a previous “teachable moment,” we learned that when importing a KVM image into glance, if it is first converted to “raw” format, creating instances from that image takes a snapshot/boot-from-volume approach. The net result of this is that for each VM we create, we end up with approximate 700MB of disk space consumed. For the 2,048 node environment, the VM pool in Ceph only took approximately 1.5TB of disk space. Compare this to the last (internal) test when we had 1,000 VMs taking nearly 22TB.
In addition to reduced I/O to create VMs and reduced disk space utilization, booting from snapshots on Ceph was incredibly fast. We were able to deploy all 2,048 guests in approximately 15 minutes. This was really cool to watch!
Bonus deployment optimization: use image-based deploys! Whether it’s on OpenStack, or any other infrastructure public or private, image-based deploys reduce much of what would otherwise be repetitive tasks, and can reduce the burden on your infrastructure significantly.
Bake in as much as you can. Review our (unsupported) Ansible-based image provisioner for a head start.
Improved Documentation for Performance and Scale
Phew! That was a lot of work..how do we ensure that the community and customers benefit?
First, we push absolutely everything upstream. Next, we bake in as much of the tunings, best practices and config optimization into the product as possible….and we document everything else.
Along with OpenShift 3.5, the performance and scale team at Red Hat will deliver a dedicated Scaling and Performance Guide within the official product documentation. This provides a consistently updated section of documentation to replace our previous whitepaper, and a single location for all performance and scalability-related advice and best practices.
Summary
The CNCF Cluster is an extremely valuable asset for the open source community. This 2nd round of benchmarking on CNCF’s cluster has once again provided us with a wealth of information to incorporate into upcoming releases. The Red Hat team hopes that the insights gained from our work will provide benefit for the many Cloud Native communities upon which this work was built:
- Kubernetes
- Docker
- OpenStack
- Ceph
- Kernel
- OpenvSwitch
- Golang
- Gluster
- And many more!
Our team also wishes to thank the CNCF and Intel for making this valuable community resource available. We look forward to tackling the next levels of scalability and performance along with the community!
Want to know what Red Hat’s Performance and Scale Engineering team is working on next? Check out our Trello board. Oh, and we’re hiring Principal-level engineers!