Guest post originally on Medium by Dotan Horovits, a CNCF speaker, a co-organizer of the local CNCF chapter in Tel Aviv
Monitoring Microservices Performance with Aggregated Trace Metrics
It’s no secret that Jaeger and OpenTelemetry are known and loved by the open source community — and for good reason. As part of the Cloud Native Computing Foundation (CNCF), they offer one the most popular open source distributed tracing solutions out there as well as standardization for all telemetry data types.
Jaeger, which is in the graduated phase within the CNCF, helps thousands of engineers track and measure requests and transactions by analyzing end-to-end data from service call chains so they can better understand latency issues in microservice architectures. However since Jaeger only enables engineers to search for and analyze individual traces, it offers just a glimpse of the picture.
But what if we want to measure and track service level performance? What if we’d like to know which service has the most errors, which operation has the highest latency, or the highest request load? In this case, the ability to analyze metrics calculated off traces would be tremendously helpful.
Just imagine seeing a high level performance snapshot right in your Jaeger homepage (I wish there were a Jaeger homepage at all):
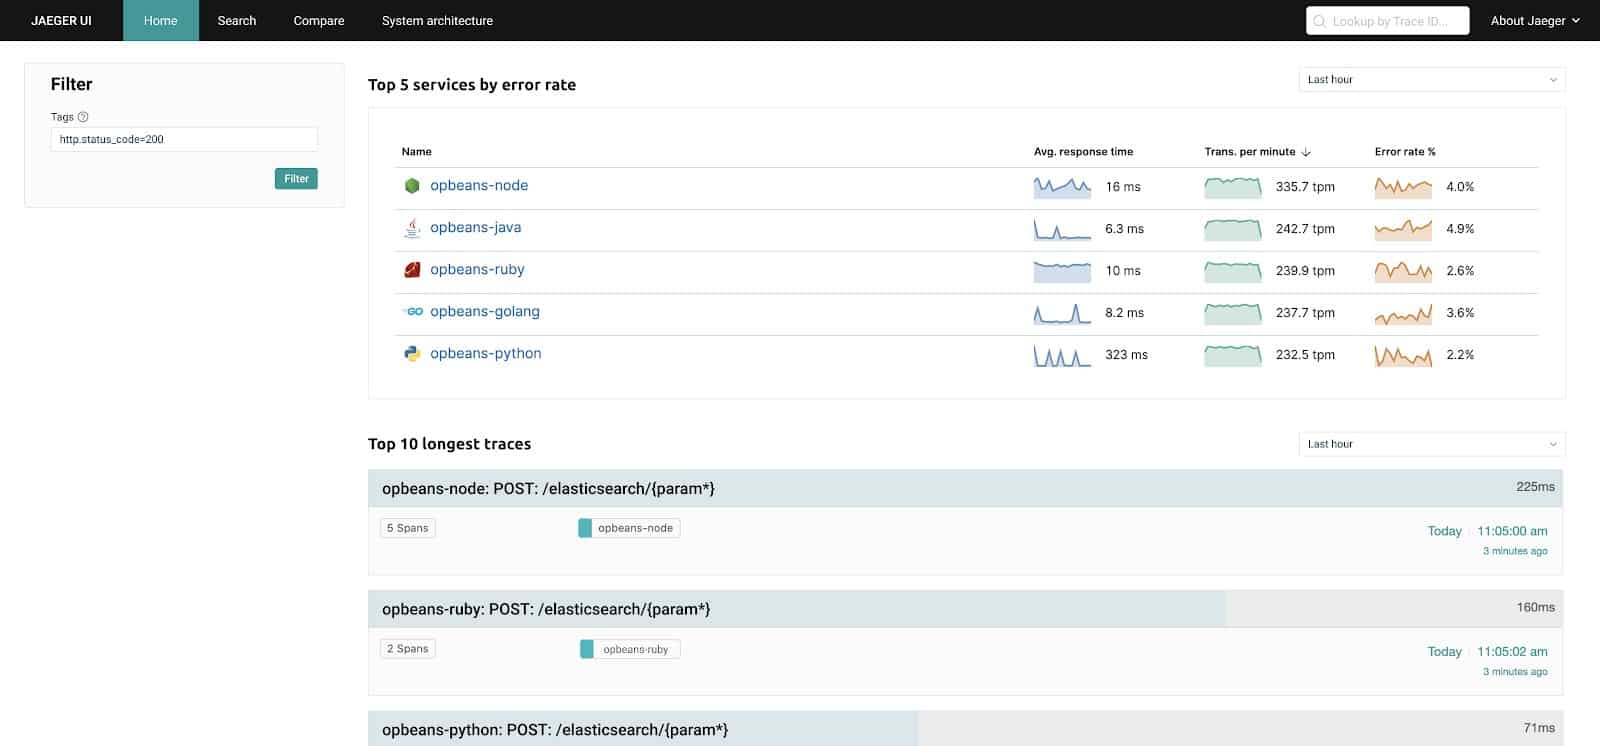
When we’ve identified this need, we realized it’s time to give back to the community, by building technology that takes OpenTelemetry and Jaeger to the next level and brings Jaeger up the stack towards application performance monitoring.
Application Performance Monitoring with Trace Metrics
Many application performance monitoring (APM) solutions offer rich, comprehensive capabilities for monitoring request performance metrics to help Operations and SRE teams manage service levels and detect issues before they are outages. RED method is particularly common for request metrics:
- Rate: the number of requests per second
- Errors: the number of failed requests per second
- Duration: the amount of time each request takes
It’s time to provide some of these capabilities to the open source community, with native support for microservices and the CNCF ecosystem. This contribution best fits OpenTelemetry — for a vendor-agnostic metric aggregation and exposition to any backend, and Jaeger — for a tracing-specialized analysis backend.
After all, with distributed tracing, the raw data is there for grabs!
A trace contains end-to-end data about the service call chain in the context of an individual request on a given service endpoint (operation).
All we need in order to take Jaeger’s observability capabilities up a notch, is to calculate aggregated trace metrics (ATMs) off of the traces.
ATMs are metrics which are calculated based on the traces as they are collected, for operational use cases. This helps engineers to see the metrics that correlate to each service and operation being analyzed. Examples of these metrics include:
- Number of requests
- Average response time
- Peak response time
- Minimum response time
- 95th percentile (p95)
And more.
You can define as many metrics (and as diverse) as you need in order to build your desired observability.
Enhancing OpenTelemetry to Calculate Trace Metrics
We want ATMs to be available for everyone to consume in a vendor-neutral way.
OpenTelemetry, a CNCF sandbox project currently evaluated for incubation, is the emerging standard for generating and collecting telemetry data of traces, metrics and logs (a.k.a. three pillars of observability) in a vendor-agnostic manner. With OpenTelemetry reaching GA for distributed tracing, it is now a viable option for production deployments. Currently, the OpenTelemetry Collector component offers the ability to receive span data from various sources, process it with composable logic (called Processors), and then export it to any compatible backend tool, such as Jaeger and Zipkin, for trace analysis.
The first step in achieving aggregated trace metrics (ATMs) was to enhance the OpenTelemetry Collector to calculate the aggregated metrics out of the incoming trace data (i.e. the spans). Our proposed Span Metrics Processor, which was contributed by Albert Teoh, is an OpenTelemetry Collector Processor which aggregates Request, Error and Duration (R.E.D.) metrics from span data. By placing this processor upfront in the processing pipeline, you’re guaranteed to aggregate the metrics over 100% of the traces, before they get trimmed down by sampling (distributed tracing typically only samples a fraction of the data), which ensures the highest credibility of the metrics.
These metrics can then be exported to any OpenTelemetry-compatible time series backend, by using an appropriate OpenTelemetry Collector Exporter across a variety of supported formats such as Prometheus, OpenCensus and OTLP.
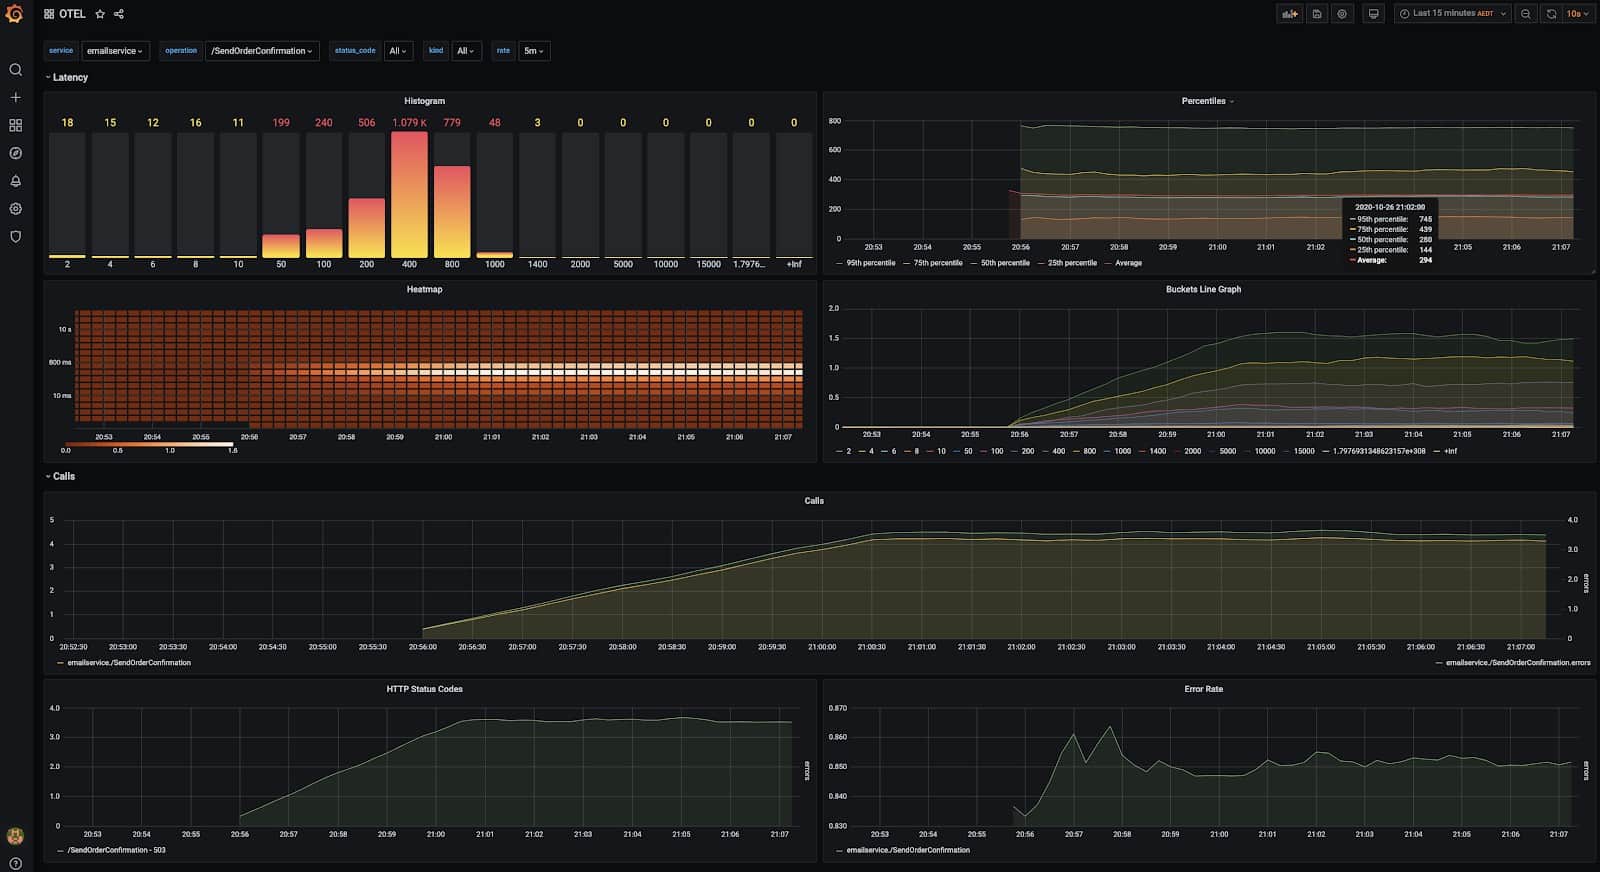
With this in place, any OpenTelemetry-compatible metrics backend, such as Prometheus, Grafana and Logz.io, will be able to consume and visualize these metrics.

In this dashboard you can see the R.E.D. metrics aggregated from span data. It contains a line graph of hit counts (Request rate), Error counts and rates, and a histogram of latencies for a specific endpoint (Duration).
This feature is ready and available to any OpenTelemetry user who wants to use it!
Simply use the latest OpenTelemetry Collector to collect trace data, add the span metrics processor in the configuration, and plug your time series analysis tool of choice with a suitable OpenTelemtry exporter.
With this open source contribution in place, we’re able to democratize aggregated trace metrics for the community.
Enhancing Jaeger to Analyze and Visualize Trace Metrics
Using Prometheus or other general-purpose time series backends to see aggregated trace metrics is great, but we’d like to take this up a notch by making ATMs first level citizens inside Jaeger, as a specialized tracing analysis tool. This will enable us more powerful analysis flows such as drill down from a metric to the respective traces.
For that end we’d like to:
- Enable Jaeger to query the ATMs metrics data
- Enhance Jaeger UI to visualize ATM data
So we designed a proposal for a new “Monitor” view in Jaeger (compliments to Dana Fridman on the great UX design), now in review by the community:
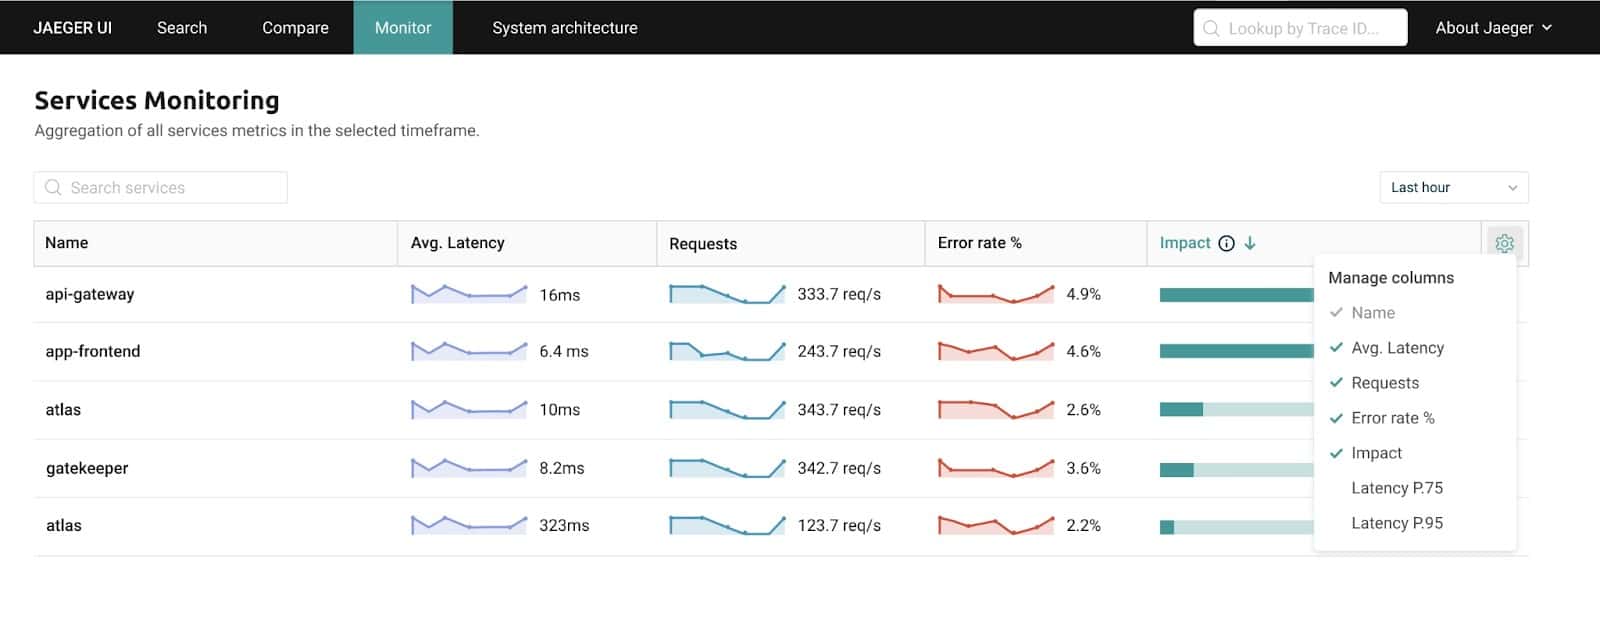
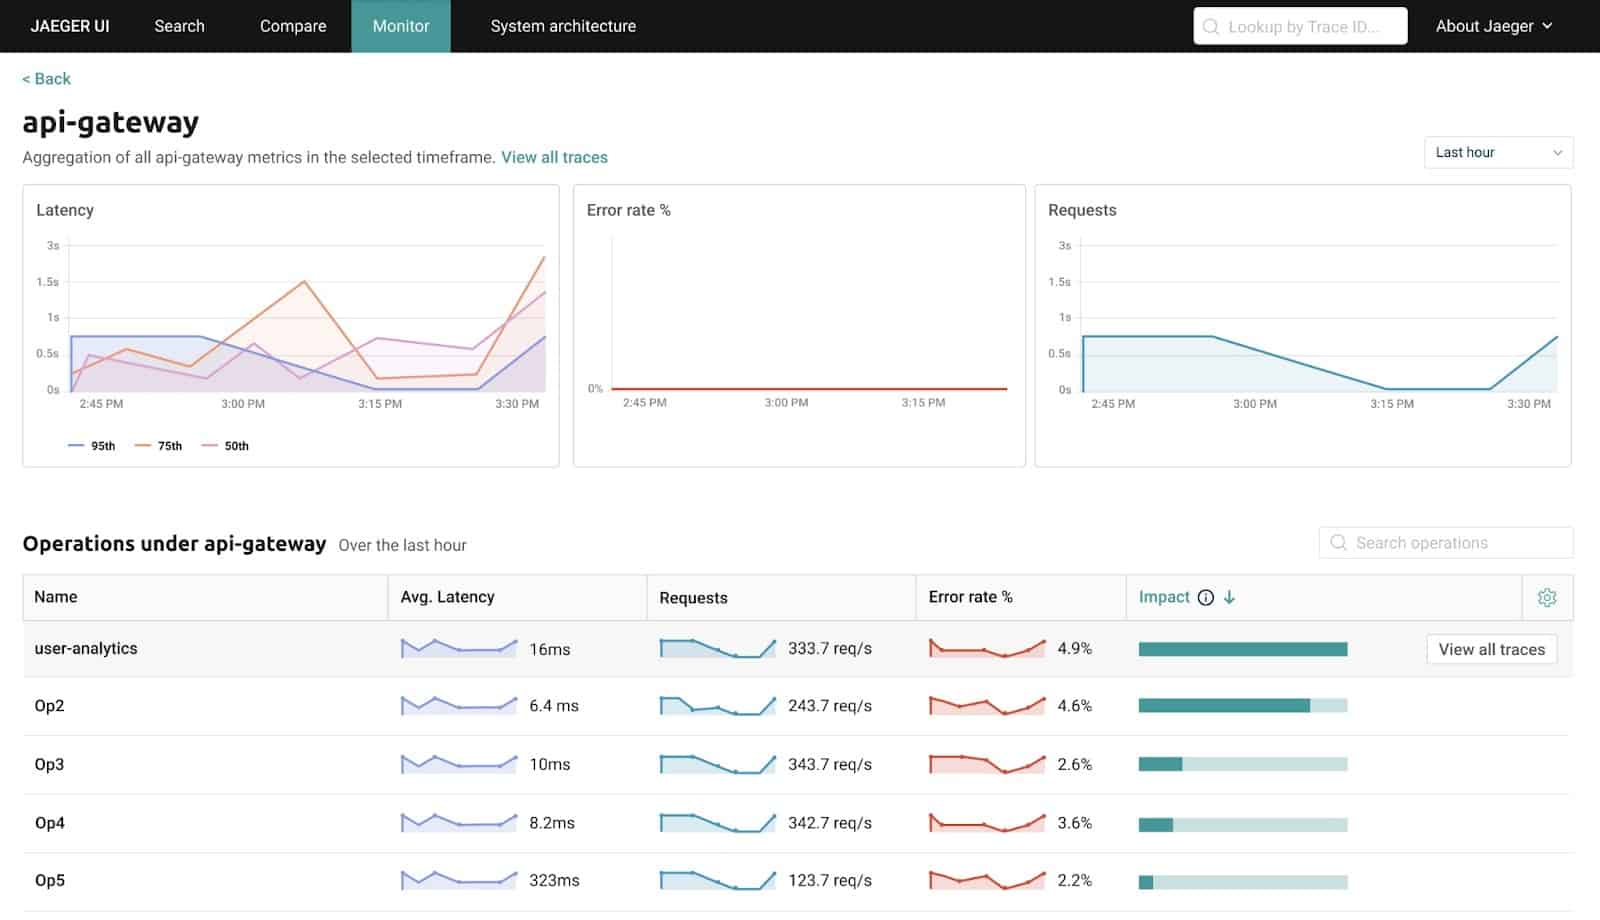
Jaeger has a jaeger-query component which is used to query the span data from the backend store. We want to enhance jaeger-query with a metrics query endpoint, which will enable running PromQL queries on the ATMs using an external PromQL-compatible time series database. I’m glad to say the design proposed by Albert Teoh has already been approved and we’re now working on contributing the implementation.
The Promise of Open Source Observability with Jaeger
This is a great example of the powerfulpotential of observability as it combines tracing and metrics telemetry types to build a more comprehensive, holistic understanding of the system behavior.
We’re excited to give back to these communities, by building technology that takes OpenTelemetry and Jaeger to the next level and brings Jaeger up the stack towards an APM.
I can’t wait to see how open source Jaeger and OpenTelemetry users benefit from aggregated trace metrics. It’s great seeing the positive reactions by the community so far:
Join the discussions on GitHub and on the Jaeger and OpenTelemetry slack channels and Gitter. Looking forward to seeing your feedback, comments, suggestions, and contributions so it can reach its full potential.
— — — — — — — — — — — — — — — — — — — — — — — — — — — — — — —
Dotan Horovits (@horovits) is a CNCF speaker, a co-organizer of the local CNCF chapter in Tel Aviv, and a developer advocate at Logz.io — Twitter LinkedIn
Logz.io provides a cloud observability platform based on ELK, Prometheus and Jaeger.