Guest post originally published on Kong’s blog by Marco Palladino, CTO at Kong
The more services you have running across different clouds and Kubernetes clusters, the harder it is to ensure that you have a central place to collect service mesh observability metrics. That’s one of the reasons we created Kuma, an open source control plane for service mesh. In this tutorial, I’ll show you how to set up and leverage the Traffic Metrics and Traffic Trace policies that Kuma provides out of the box.
If you haven’t already, install Kuma and connect a service.

1:01:56
Webinar: Observability, Service Mesh and Troubleshooting Distributed Services Register here >>
Tutorial: Service Mesh Observability Metrics
Observability will give you a better understanding of service behavior to increase development teams’ reliability and efficiency.
Traffic Metrics
Kuma natively integrates with Prometheus for auto-service discovery and traffic metrics collection. We also integrate with Grafana dashboards for performance monitoring. You can install your own Prometheus and Grafana, or you can run kumactl install metrics | kubectl apply -f – to get up and running quickly. Running this will install Prometheus and Grafana in a new namespace called kuma-metrics. If you want to use Splunk, Logstash or any other system, Kuma supports those as well.
Once you have your Prometheus and Grafana infrastructure up and running, you should update your default service mesh tool to enable automatic metrics collection by exposing the built-in Prometheus side. You’ll need to make sure that mutualTLS is enabled first.
| 12345678910111213141516171819202122 | “apiVersion: kuma.io/v1alpha1kind: Meshmetadata: name: defaultspec: metrics: enabledBackend: prometheus-1 backends: – name: prometheus-1 type: prometheus mtls: enabledBackend: ca-1 backends: – name: ca-1 type: builtin dpCert: rotation: expiration: 1d conf: caCert: RSAbits: 2048 expiration: 10y” | kubectl apply -f – |
After that, you should be able to see the traffic metrics you have enabled in the GUI.
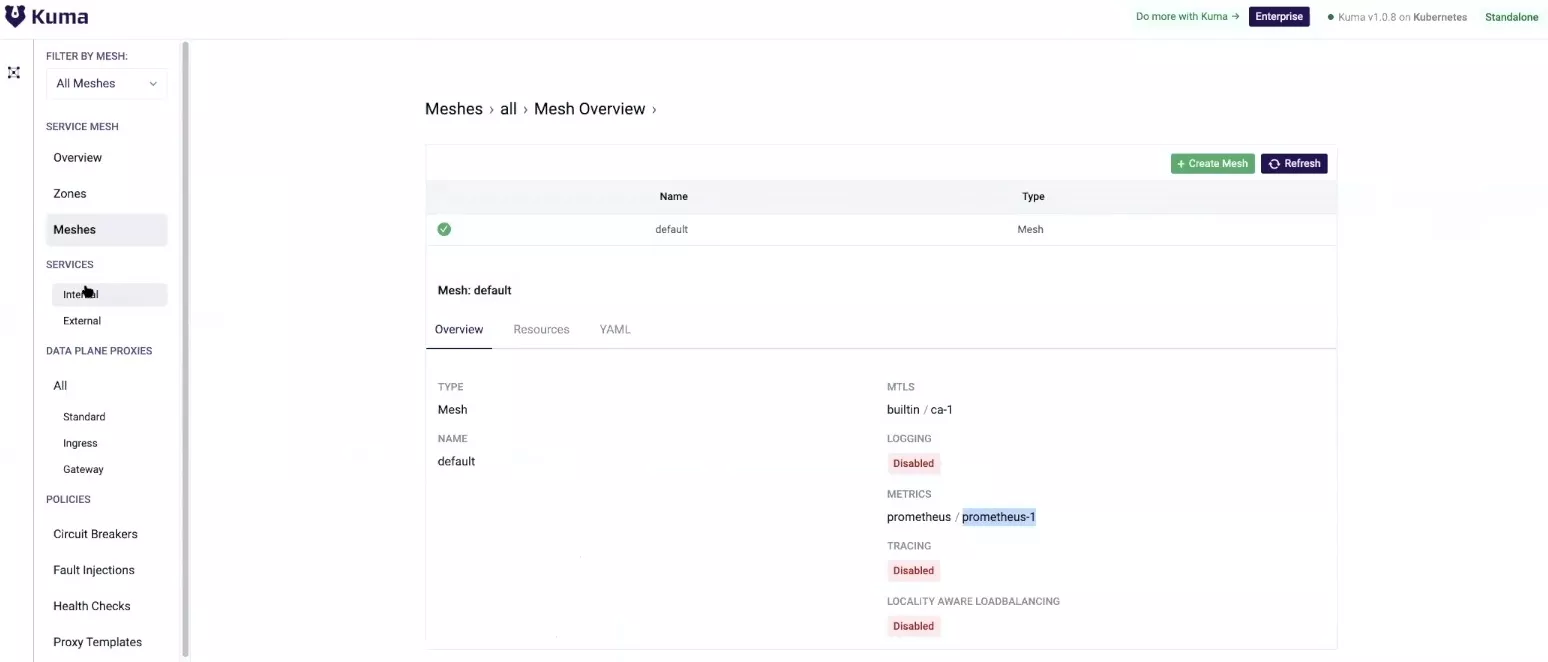
Next, expose Grafana so that you can look at the default dashboards that Kuma provides. To do this, port forward Grafana from the Kuma metrics namespace.

In Grafana, there are four dashboards that you can visualize out of the box.
- Kuma Service to Service
- Kuma CP
- Kuma Mesh
- Kuma Dataplane
You should see an overview of the meshes you’re running, including the data planes and the bytes flowing to Envoy.
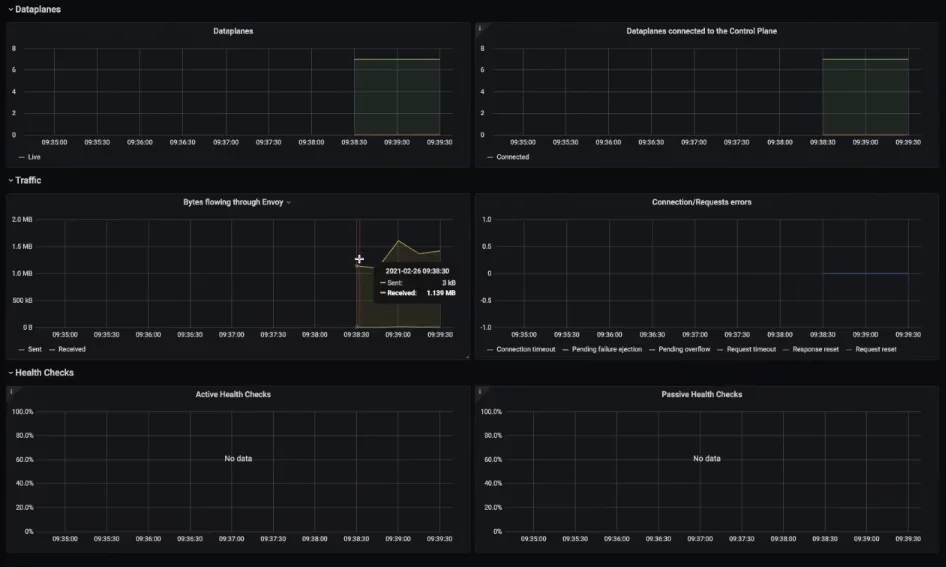
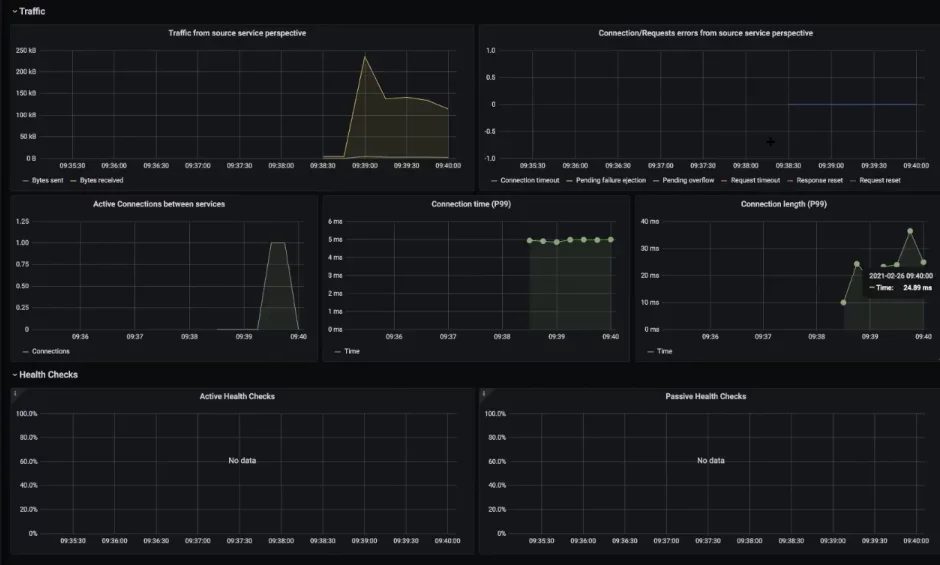
In my example, I can see all the network traffic from my sample application to Redis, including requests.
I can visualize the actual control plane metrics to determine the overall performance of the control plane. This information will be helpful as you scale your service mesh technology. It’ll help you determine if your control plane is experiencing a bottleneck situation or not.
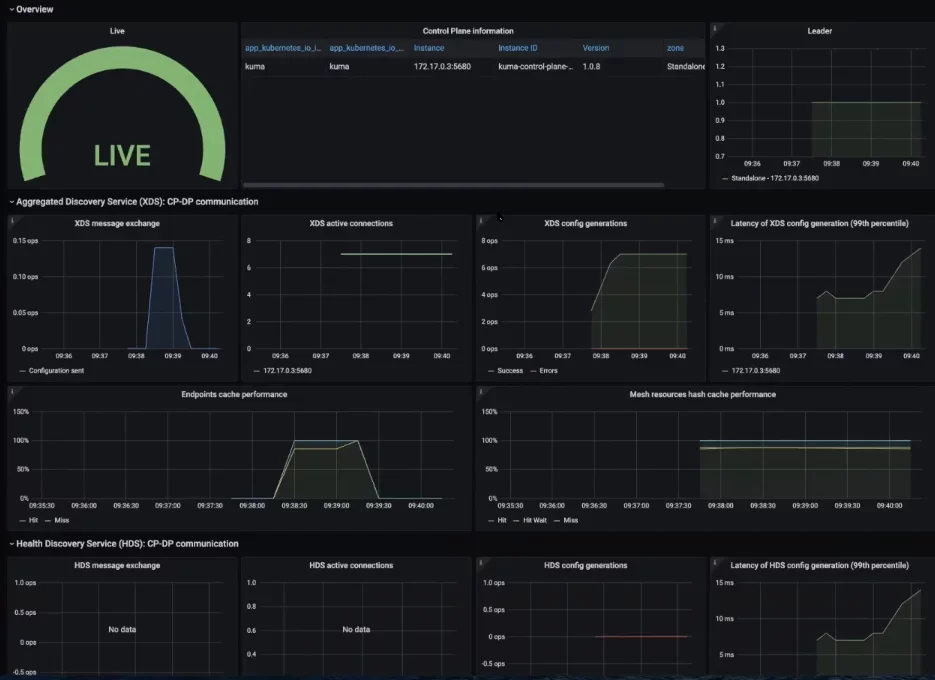
My example is a standalone deployment. For multi-zone deployments, you would be able to visualize the global and remote metrics.
Incorporating an Ingress Gateway
What I did above is a little bit of an anti-pattern. I should not be consuming applications by port forwarding the sample application. Instead, I should use an ingress, like Kong Ingress Controller. Kuma is universal on both the data plane and the control plane. That means you can automatically deploy a sidecar proxy in Kubernetes with automatic injection.
Since Kong Ingress Controller is an API gateway, it provides all sorts of features and plugins, including authentication, rate limiting and bug detection. You can use these plugins to enhance how you want services consumed from within the mesh.
Install Kong Ingress Controller
To install Kong Ingress Controller inside my Kubernetes cluster, I’ll open a new terminal. There should be a new Kong namespace.
To include this as part of the service mesh, you should annotate the Kong namespace with the Kuma sidecar injection. When Kuma sees this annotation on a namespace, it knows that it must inject the sidecar proxy to any service running here into that namespace.
Lastly, retrigger a deployment of Kong to inject the sidecar. You should see the sidecar showing up in your API gateway data planes.
With Kong Ingress Controller up and running, I’ll expose the address of my minikube. There is no ingress rule defined. That means Kong doesn’t know how to route this request. There’s no API, so Kong doesn’t know how to process it.

To tell Kong to process this request, I must create an ingress rule. I’ll make an ingress rule that proxies the route a path to my sample application.
| 12345678910111213141516 | “apiVersion: extensions/v1beta1kind: Ingressmetadata: name: demo-ingress namespace: kuma-demo annotations: kubernetes.io/ingress.class: kong konghq.com/strip-path: ‘true’spec: rules: – http: paths: – path: / backend: serviceName: demo-app servicePort: 5000” | kubectl apply -f – |
After refreshing, I see my sample application running through the ingress.
Traffic Trace
Injecting distributed tracing into each of your services will enable you to monitor and troubleshoot microservice behavior without introducing any dependencies to the existing application code.
To capture traces between Kong and your applications, you can use Kuma’s Traffic Trace policy. Kuma provides a native Jaeger and Zipkin integration so I can run kumactl install tracing | kubectl apply -f -. This provides a helper that creates Zipkin and Jaeger automatically in a new namespace called kuma-tracing.
After that’s running, you could go ahead and update your service mesh definition with the new distributed tracing property. That allows you to determine what backend to use, how much of those requests to trace and where to push them. If you’re running these in the cloud as a managed service, you could be setting up your third-party destination for your traces.
| 12345678 | tracing: defaultBackend: jaeger-collector backends: – name: jaeger-collector type: zipkin sampling: 100.0 conf: url: http://jaeger-collector.kuma-tracing:9411/api/v2/spans |
In the GUI, you should see that distributed tracing is enabled.
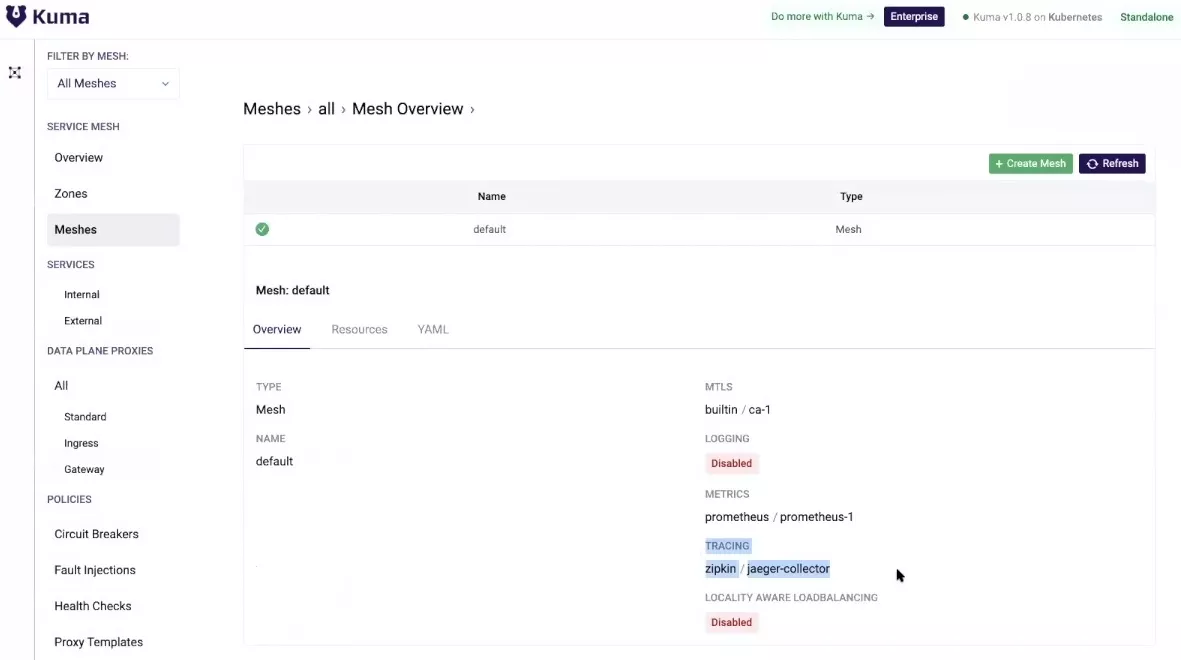
Next, add the traffic trace resource that determines what services you want to trace. In this case, I want to trace them all, and I want to store those traces in the Jaeger collector backend. I’ll create this resource.
| 1234567891011 | “apiVersion: kuma.io/v1alpha1kind: TrafficTracemesh: defaultmetadata: name: trace-all-trafficspec: selectors: – match: kuma.io/service: ‘*’ conf: backend: jaeger-collector” | kubectl apply -f – |
Once some traffic comes through the gateway, I’ll expose the tracing service to see those traces.

If I go to port 3000, I should see the Jaeger UI. I’m generating some traffic. I’ll trigger a request, increment my Redis and refresh Jaeger. Now my traces are automatically showing up in Jaeger.
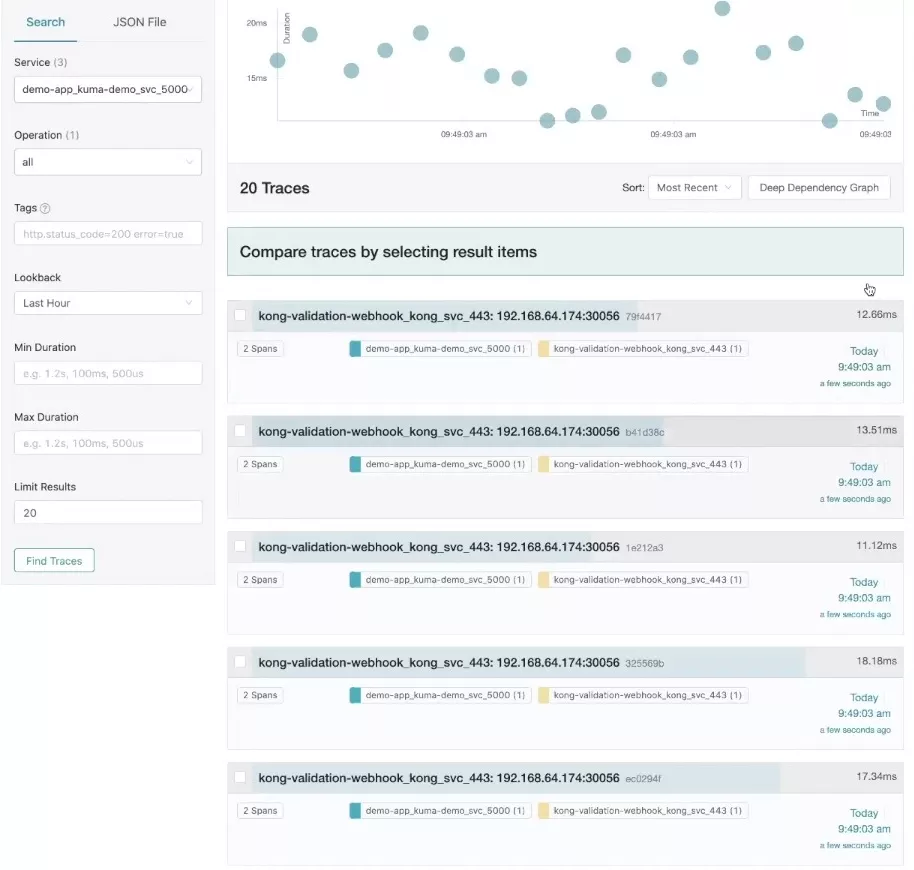
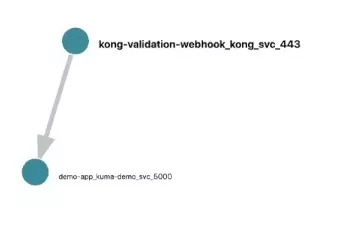
Now you should be able to visualize the spans and the time. You could push this through any system that gives you access to a service map. The below screenshot shows a basic service map that Jaeger provides.
Automate Service Mesh Observability With Kuma
Whether you have a few services or thousands of services, the process of automating service mesh observability with Kuma would be the same.
We designed Kuma, built on top of the Envoy proxy, for the architect to support application teams across the entire organization. Kuma supports all types of systems teams are running on, including Kubernetes or virtual machines.
I hope you found this tutorial helpful. Get in touch via the Kuma community or learn more about other ways you can leverage Kuma for your connectivity needs with these resources: