Guest post by Michelle Nguyen, Principal Software Engineer at New Relic
As a way to reemphasize our commitment to open source and open standards, we are sharing an exciting development in open source observability. Pixie, a real-time debugging platform for Kubernetes, has just announced their plugin system.
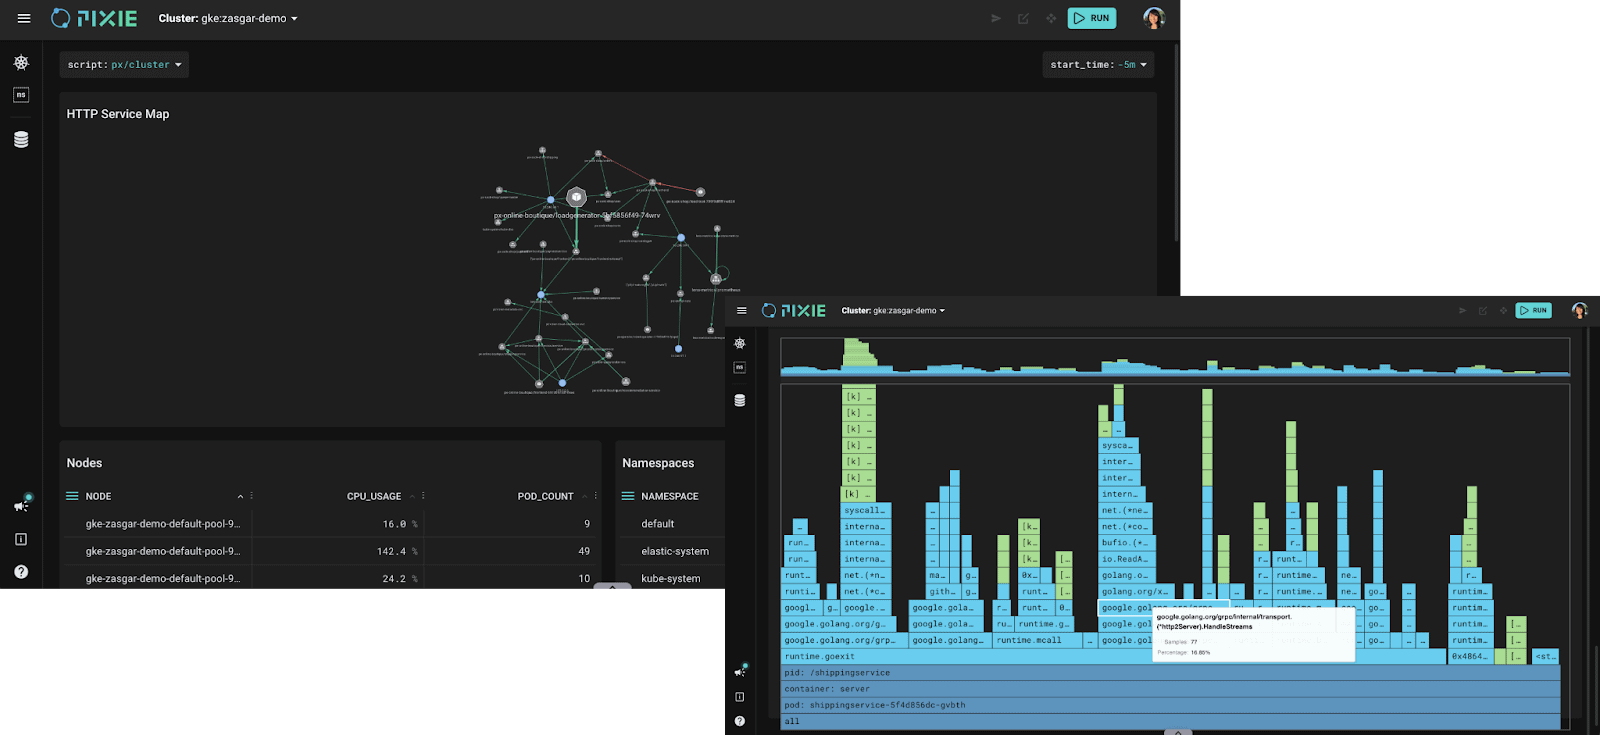
The plugin system allows users to export data from Pixie’s rich dataset to any tool which supports OpenTelemetry. This includes data such as pod details, full-body application requests, flame graphs, and more. Using Pixie’s auto-telemetry capabilities, this means you can immediately start exploring Pixie data within your favorite platform, without having to do any manual instrumentation.
We’ll discuss:
- The significance of open source and open specifications in observability
- What Pixie is and the data it collects
- Benefits of the Pixie Plugin System
- Next steps for how to get started with the Pixie Plugin System
Open Specifications and APIs for Observability
In the days of proprietary agents, deploying a collector typically required that data be sent to its corresponding dashboard platform for analysis. Deploying another unsupported data source would require yet another product to adopt and learn. Most teams report that they are using up to 15 projects just for observability [1]! Ultimately, this leads to data and process silos across teams, making it impossible to build a complete picture of their cluster and applications.
Open source data collectors and standards, such as OpenTelemetry, solve this problem by improving interoperability in observability tooling. By leveraging data collectors that follow open standards, developers can send data to their platform of choice. Switching out that platform is as easy as updating a set of configs. This enables developers to flexibly select products that best fit their needs. Many projects have now adopted open standards, from Jaeger to Fluentd.
Pixie’s Plugin System

New Relic is a proud contributor to Pixie, a CNCF sandbox project which has recently joined this movement by introducing the Pixie Plugin System.
By leveraging technology like eBPF, Pixie is able to automatically collect telemetry data from your cluster without requiring any manual instrumentation. Some of the data that Pixie is able to collect are:
- Resource metrics
- Network metrics
- Application profiles
- Full-body application requests
All of this data is stored in-cluster for performance and security benefits, with only minor CPU impact (up to 5% overhead).

Pixie’s new plugin system utilizes open standards to leverage the strengths of other tools in the ecosystem. The initial version of the plugin system addresses Pixie’s data storage limitations. As Pixie stores its collected data in-cluster, this restricts data storage within Pixie to the last 24 hours. The plugin system now allows developers to export their Pixie data in the OpenTelemetry format to any tool for long-term data retention. This enables users to:
- Persist Pixie data as reference for historical trends
- Seamlessly adopt Pixie into their established workflows and dashboards
- Join Pixie data with other useful datastreams
Getting Started
It’s easy to give the plugin system a try! Here are some materials to help you get started:
- Follow these instructions to enable a plugin
- Learn how to export any data using the Export OpenTelemetry Data tutorial
- See all available plugins
- Learn how to contribute a plugin
[1] https://www.cncf.io/wp-content/uploads/2022/03/CNCF_Observability_MicroSurvey_030222.pdf