Guest post originally published on Grafana Labs’ blog
Kubernetes makes it easier for businesses to automate software deployment and manage applications in the cloud at scale. However, if you’ve ever deployed a cloud native app, you know how difficult it can be to keep it healthy and predictable.
DevOps teams and SREs often use distributed tracing to get the insights they need to learn about application health and performance. With tracing, you use a set of identifiers for signals extracted from services so they can be leveraged down the line to reconstruct the transaction. This can inform and accelerate a user’s troubleshooting journey.
This article focuses on distributed tracing as a solution for Kubernetes workload monitoring. You’ll learn more about the importance of distributed tracing and how it works so you can implement it in your Kubernetes projects.
What is distributed tracing in Kubernetes?
Distributed tracing is based on concepts Google published in its Dapper paper back in 2010. The idea is to implicitly observe how a set of services interact with each other by having each service emit information about the actions it performed and enrich those signals with a common identifier.
We call those single signals “spans” and they usually have a descriptive name and a unique identifier. A single span is part of a “trace,” which is comprised of n spans. Every span can have unlimited children.
This data model guarantees that a trace can be continued as long as the trace ID is preserved and new spans carry this ID. Every service needs to propagate this correlation information to the next downstream service to make this mechanism work.
In the context of Kubernetes, think of each of your own application services or the platforms’ components as a possible creator of such a span. Then, if you want to understand how an application performs, follow the trail of spans created by those components and look at the metadata, such as duration or Kubernetes-related attributes.
Distributed tracing vs. logging
Even today, there is confusion about the difference between Kubernetes metrics, logs, and traces. This is understandable, as each is a fundamental part of the cluster’s observability strategy.
In simple terms, Kubernetes logs provide insights about events that occurred within a microservice. This information is especially valuable during troubleshooting. Distributed tracing covers a different angle by providing invaluable data about what happens between microservices as they interact with each other and how they relate to the rest of the distributed system.
Essentially, logs and traces complement each other to give DevOps teams at-a-glance observability insights into interactions between requests, services, and processes running in a Kubernetes ecosystem.
How to identify distinct requests
Using a unique identifier (the trace ID) to monitor a specific request tells you how it is performing while interacting with hundreds of other services. This makes distributed tracing a vital part of a cluster-wide Kubernetes observability strategy. It is the most trustworthy method to gain insights into the collection of loosely coupled services that build an application in the already complex cloud infrastructure.
Distributed tracing may seem simple, but it actually provides valuable information about your Kubernetes cluster. Here are some examples of the potential benefits:
- End-to-end visibility. Developers and operators use distributed tracing tools to trace the interactions of user requests with other microservices. By utilizing GPS navigation and coordinates, DevOps teams can easily track performance, throughput, functionality, and infrastructure bottlenecks through a retrospective of every point on the map.
- Service dependencies. You should use distributed tracing to discover any dependencies and interactions between different services.
- Anomaly detection. Use healthy traces as a reference to easily detect anomalies that impact application performance.
- Enhanced application debugging. Use distributed tracing tools in conjunction with cluster logs and metrics for application debugging and troubleshooting.
How distributed tracing works
To understand what’s happening inside a microservice-based Kubernetes application, we first need the context of container interactions within that application. Containers within a pod can:
- Interact with each other
- Communicate with other pods within the same node or on a different node
- Talk to the outside world or reach to external resources, e.g., storage
- In a multicloud deployment, pass app requests from one cluster to another
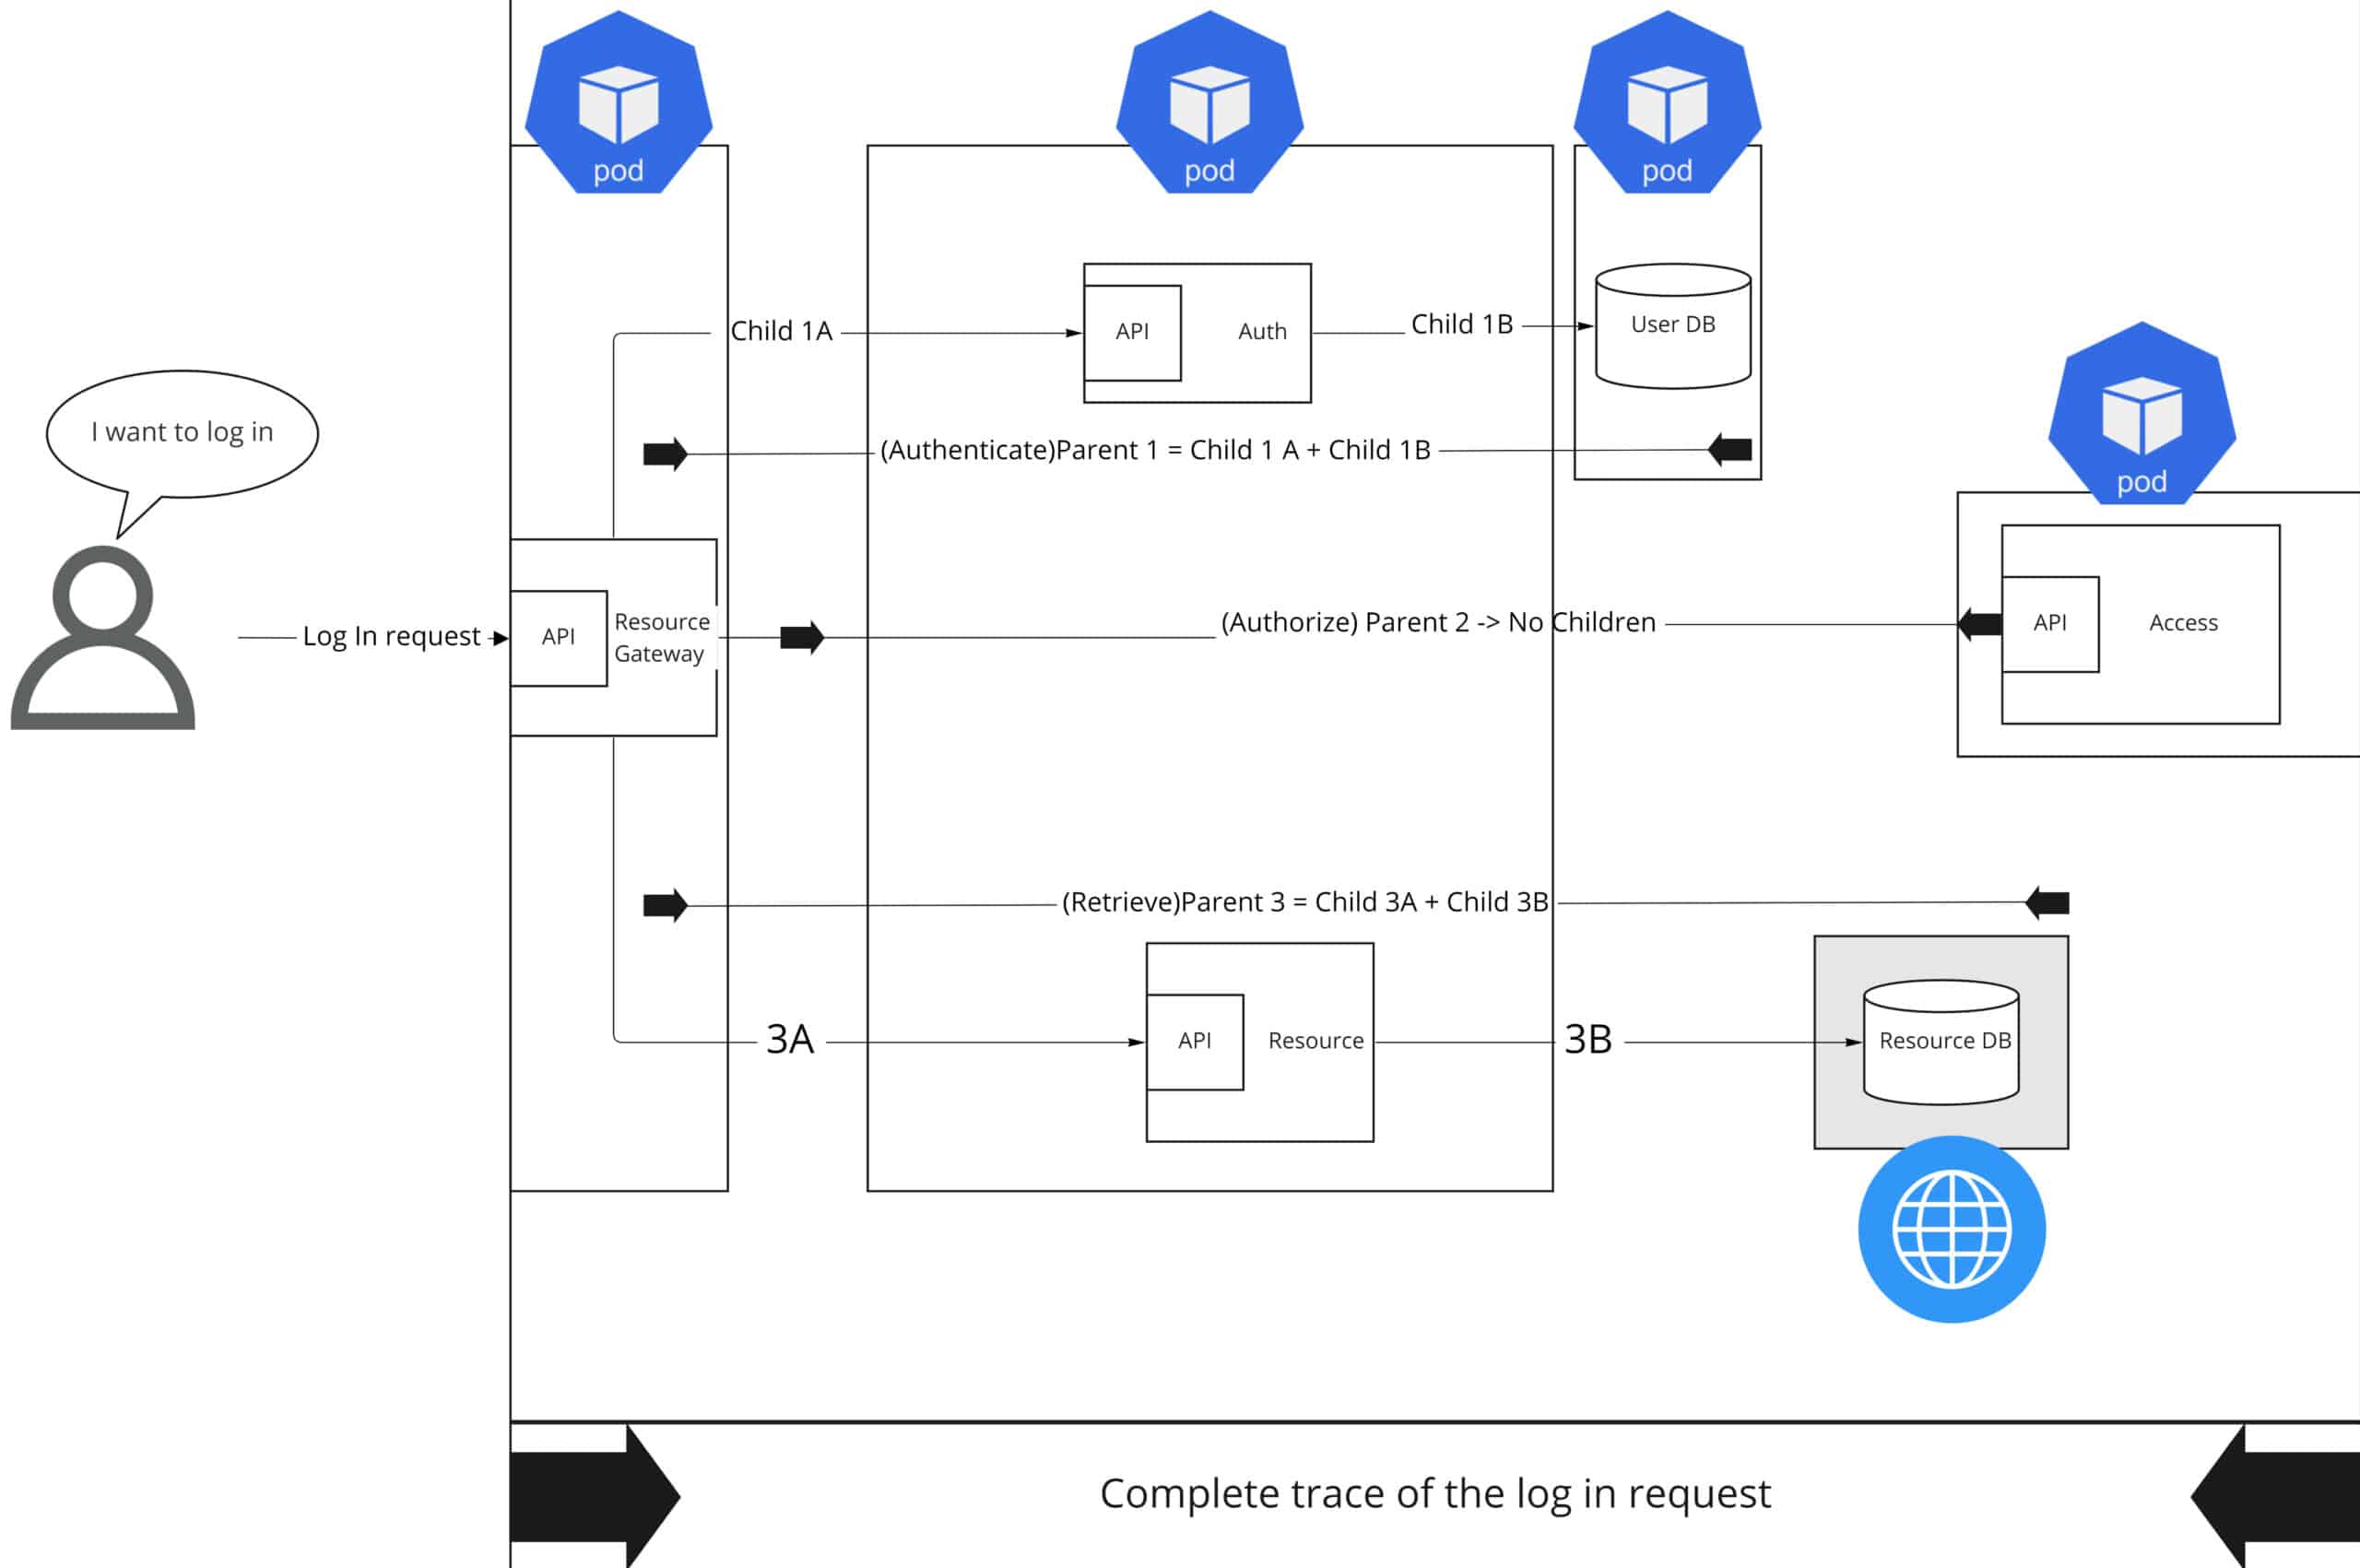
Distributed tracing follows the path of a request through that complex system of interactions. It provides the sequence and timing of the microservices or actions triggered within or outside the container, pod, node, or even cluster. Look at the desired result below to see how this is done:

The image above is a simplified representation of a distributed system, where each microservice has its API, each microservice is in its own pod, and one database is external. Each line represents an interaction. Other concepts used here are spans and trace context, e.g., What does the trace include? Here’s some additional background information on spans and trace context:
- Spans. Think of a span as a single unit of work, such as an operation or interaction, with a unique name and timestamp. A trace can be made up of one or multiple spans. In the example shown above, the parent span represents the original user request, and each subsequent span is a unique operation within the distributed system.
- Trace context. According to the World Wide Web Consortium (W3C), a trace context is a specification that “standardizes how context information is sent and modified between services.” This specification provides a unique identifier to each individual request, which enables you to track vendor-specific metadata even if different tracing tools are used in the same transaction.
Developers and admins use distributed tracing tools to gain insights into the performance of user requests as they interact with other services by dividing each trace into spans, whose propagation is recorded using the trace context specification. Although this approach is simple, its implementation requires different components, which will be discussed below.
Major components in distributed tracing toolkits
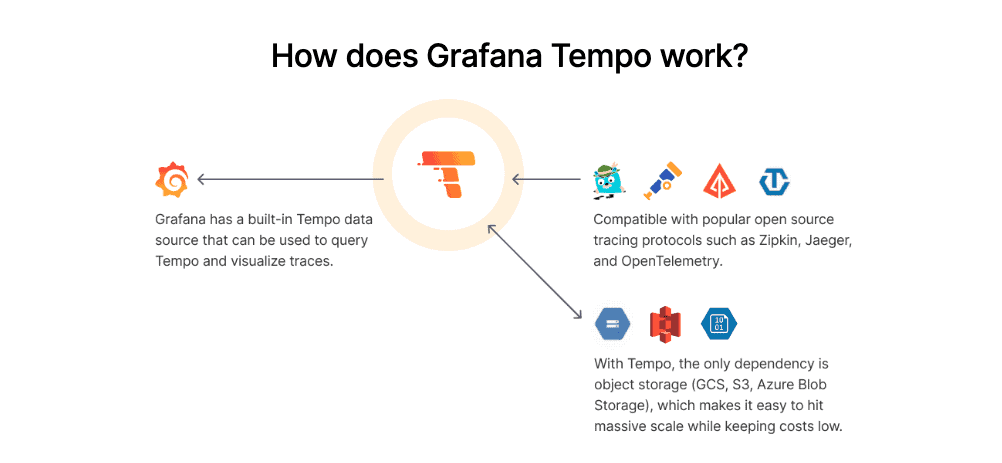
Distributed tracing tools work similarly and generally use the same components. However, there can be differences in the way they are implemented, their architecture, and even the tracing protocols used. For the purposes of this guide, we’ll use Grafana Tempo as our example.

Like most distributed tracing ecosystems, Grafana Tempo relies on four components to make it useful:
- Instrumentation. In simple terms, this component provides the telemetry data that will later be collected — traces, in this case — but it can also generate metrics and logs used by other tools. There are different standards for collecting telemetry data for applications and services, which we’ll cover later. Grafana Tempo supports OpenTelemetry (via OTLP), Zipkin, and Jaeger protocols for collecting telemetry data. There are libraries and frameworks that allow developers to generate traces from the application code, but as of v1.22, Kubernetes system components can also transmit traces using the OpenTelemetry protocol.
- Pipeline. Distributed tracing tools usually receive telemetry data from multiple sources simultaneously, so you’ll need to optimize the resources used by the tool as the application scales. To this end, tracing pipelines perform functions such as data buffering, trace batching, and subsequent routing to the storage backend. For this important task, Grafana Tempo can use the Grafana Agent, which is the same telemetry collector used to scrape metrics and logs in the Grafana ecosystem.
- Storage backend. After the traces are collected, they must be stored for later visualization and analysis. You need a storage backend capable of scaling with the application without consuming too many resources in the process. Grafana Tempo takes an innovative approach: Instead of relying on resource-hungry, in-memory databases, it uses popular object storage solutions such as Amazon S3, Google Cloud Storage, and Microsoft Azure Blob Storage as its trace storage backend. If needed, query performance can be optimized by using Memcached or Redis.
- Visualization layer. Tempo can be coupled with Grafana for visualizations and to create dynamic dashboards that correlate metrics, logs, and traces in Kubernetes.
Open source distributed tracing standards
In all likelihood, most tools will soon use a single distributed tracing standard; however, it’s a good idea to know the current state of open source tracing protocols:
- OpenTracing. Archived but still viable, OpenTracing is a vendor-neutral instrumentation API for distributed tracing. Inspired by Zipkin, the OpenTracing API provides cross-platform compatibility thanks to client libraries available in languages such as Go, JavaScript, Java, Python, Ruby, and PHP. Some tools that use this standard are Zipkin, Jaeger, and Datadog.
- OpenCensus. According to its documentation, OpenCensus “originates from Google, where a set of libraries called Census are used to automatically capture traces and metrics from services.” Similar to OpenTracing, OpenCensus has libraries in multiple languages, including Go, Java, C#, Node.js, C++, Ruby, Erlang/Elixir, Python, Scala, and PHP. Backends that support OpenCensus include Azure Monitor, Datadog, Instana, Jaeger, New Relic, SignalFx, Google Cloud Monitoring, and Zipkin. OpenCensus and OpenTracing were merged into OpenTelemetry in 2019, though they are still used separately at companies with custom monitoring tools.
- OpenTelemetry. Think of OpenTelemetry as a collection of tools, APIs, and SDKs resulting from the fusion of the best features of OpenTracing and OpenCensus. OpenTelemetry code instrumentation is supported in more than 11 programming languages. However, one advantage that stands out is the OpenTelemetry Operator for Kubernetes, which makes it easy to instrument applications developed in Java, Node.js, and Python. OpenTelemetry has a promising future as a de facto standard, which has earned it the support of prominent vendors in the IT industry, such as AWS, Microsoft, Elastic, Honeycomb, and Grafana Labs.
Despite the feature overlap between OpenTracing and OpenCensus, it’s fair to say that tools with OpenTelemetry support have an edge over the rest. Grafana Tempo is in the unique position of offering native support for both OpenTelemetry and the instrumentation protocols used by Zipkin and Jaeger. In other words, without the need to modify the application code, your organization can use Zipkin or Jaeger instrumentation with Tempo.
Distributed tracing tools
Because there are so many tools available, it’s worth digging into some of the details about the most popular open source distributed tracing solutions for Kubernetes. They all work similarly, so a high-level comparison between them is fairly straightforward.
- Zipkin is one of the pioneers in developing distributed tracing solutions. Initially developed by Twitter and written in Java, its features include support for Cassandra and Elasticsearch as storage backends as well as support for the OpenTracing standard.
- Jaeger is a somewhat younger project than Zipkin. It was initially created by Uber Technologies but later became an incubator project of the Cloud Native Computing Foundation (CNCF). It’s written in Golang, and like Zipkin, it supports Cassandra and Elasticsearch as storage backends. One notable difference is that it is fully compatible with the OpenTracing standard.
- Grafana Tempo is the most recent project on the list. Developed by Grafana Labs, Tempo was built from the ground up to be highly scalable, cost-effective, and flexible. It also supports object storage providers for storing traces, and it’s compatible with the Zipkin, Jaeger, and OpenTelemetry protocols.
If you’re interested in a managed monitoring solution, check out Kubernetes Monitoring in Grafana Cloud, which is available to all Grafana Cloud users, including those in our generous free tier. If you don’t already have a Grafana Cloud account, you can sign up for a free account today!