Ambassador post originally published on Logz.io’s blog by Dotan Horovits
The topic of continuous profiling has been an ongoing discussion in the observability world for some time. I said back in 2021 that profiling was set to be the next major telemetry signal in observability, and in fact, since then there’s been growing interest in profiles.
Startups and large observability vendors have gotten into this domain. A significant recent step was when the OpenTelemetry project decided to add profiles to its core signals and formalized the open unified specification for that.
I hosted a special panel-style episode of OpenObservability Talks to look into the state of profiling, and into the work of OpenTelemetry in that regard. My guests were both members of OpenTelemetry special interest group (SIG) founded for this topic, Felix Geisendörfer and Ryan Perry.
The Rise of Continuous Profiling
I began by reflecting on the growing interest in continuous profiling, which has seen startups and major vendors alike focusing on this domain. Ryan shared his entrepreneurial journey, from recognizing the untapped potential of continuous profiling to founding Pyroscope and later joining Grafana Labs. This story joins Intel’s acquisition of Granulate, Elastic’s acquisition of Optimyze and others, in a bustling market.
Profiling, historically associated with performance and cost analysis, has evolved to encompass a broader spectrum of use cases, including signal correlation, incident response, and resource consumption analysis.
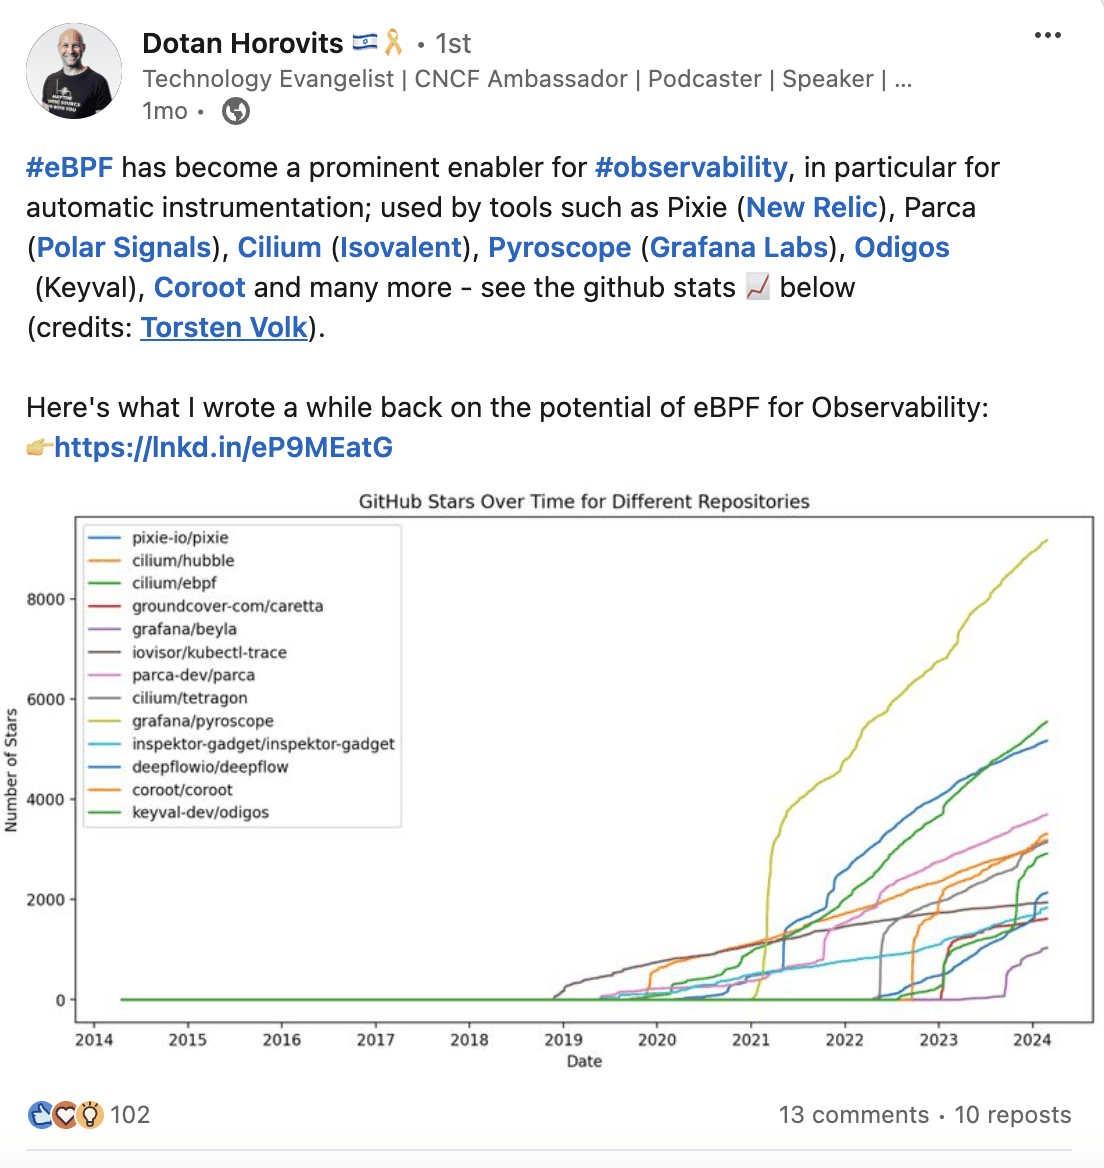
Ryan highlighted the shift towards continuous profiling, paralleling the trajectory of logs, metrics, and traces. Profiling data, when correlated with other signals, enables deeper insights into application behavior, facilitating root cause analysis and performance optimization. Use cases span from identifying CPU spikes and memory issues to understanding mutex contention, network jitter and goroutine behavior. eBPF technology is also gaining a lot of traction in this domain.

Runtime and eBPF Full-Host Approaches to Profiling
Felix delved into the nuances of different profiling approaches, contrasting runtime profilers with full-host profilers.
Runtime profilers are based on programming language specific instrumentation with SDKs, and therefore offer deep data around CPU, memory allocation, heap, lock contention, correlation with individual spans and similar capabilities tailored to specific programming languages. These, however, may require some manual instrumentation work by the user, to gain this full potential.
Full-host profilers are based on eBPF automatic instrumentation, and as such they provide comprehensive visibility across the entire system, with lower instrumentation effort on the user side. However, challenges such as symbol management and runtime compatibility underscore the complexity of the eBPF approach.
Turning Profiling Data Into Observability Insights
The discussion expanded to explore novel visualization techniques beyond traditional flame graphs. Timeline views, depicting individual thread or goroutine activities in the program over time, offer granular insights into resource utilization and thread interactions. Felix describes the type of granular investigative flow: “if it’s on CPU, what it’s doing there for how long, and if it’s off CPU, what it’s waiting for? Is it waiting for a timer? Is it waiting for the network? Is it waiting for a mutex that it’s getting blocked on?” This can extend also to investigating the connections between these goroutines and how they communicate.
We also discussed the potential of transforming profiling data into metrics, as certain things can only really be measured with profiling. A good example for that is measuring the amount of work done by the garbage collector on Go. While the Go runtime doesn’t have information about the operating system scheduling of the garbage collector (or other) goroutines, this timing is easily obtained with profiling.
OpenTelemetry Adds Support for Continuous Profiling
As the first charter of OpenTelemetry drew closer to general availability in late 2022, the community started exploring the roadmap, and has identified continuous profiling as the next signal beyond logs, metrics and traces. This carried on an earlier proposal by Sean Marciniak (a.k.a. MovieStoreGuy) from 2020.
This was then formalized in the form of an OpenTelemetry Enhancement Proposal (OTEP), and the subsequent formation of SIG Profiles, dedicated to how continuous profiling could be implemented into OpenTelemetry.
There were basic questions at first about how to even go about implementing continuous profiling into OpenTelemetry. Should it piggyback on existing models of logs or other signals, or should it be an entirely new one built from the ground up?

The SIG needed to balance between the domain-specific conventions of profiling, and framework-specific conventions of OpenTelemetry. They needed to figure out if the data model and specification should be derived from one of the many existing profiling formats out there or something new.
As Felix explained, “We needed a format that was fully specifying everything that needs to go in the flame graph, and pprof was really the only choice that we could base off. JFR is a great format, but JFR is not a standardized format. It is basically not documented and only lives in the runtime internals of the Java platform.”
And on the other hand, the SIG had to contend with how to approach profiling in a way that was in line with the existing approach employed for the existing OpenTelemetry signals. Striking this balance with the required performance goals in mind was a delicate task.
In the end, the decision was made to go with a data model that extends the pprof specification, in what the group is calling “pprof-extended.” pprof is an established open source tool by Google for visualization and analysis of profiling data. The SIG’s choice doesn’t fully align with pprof, but rather extends it.
In effect, this is a fork, which in my opinion isn’t ideal. I wish we could see Google joining this initiative, donating pprof and making it part of OpenTelemetry, for the benefit of the open source ecosystem of both projects.
Then, when the profile data reaches the OpenTelemetry Collector, it is ingested and processed in a uniform manner similar to other signals. This means the data is deconstructed into the pdata internal data format of the collector. Then, the processors that come after the receivers can do some interesting things with the data.
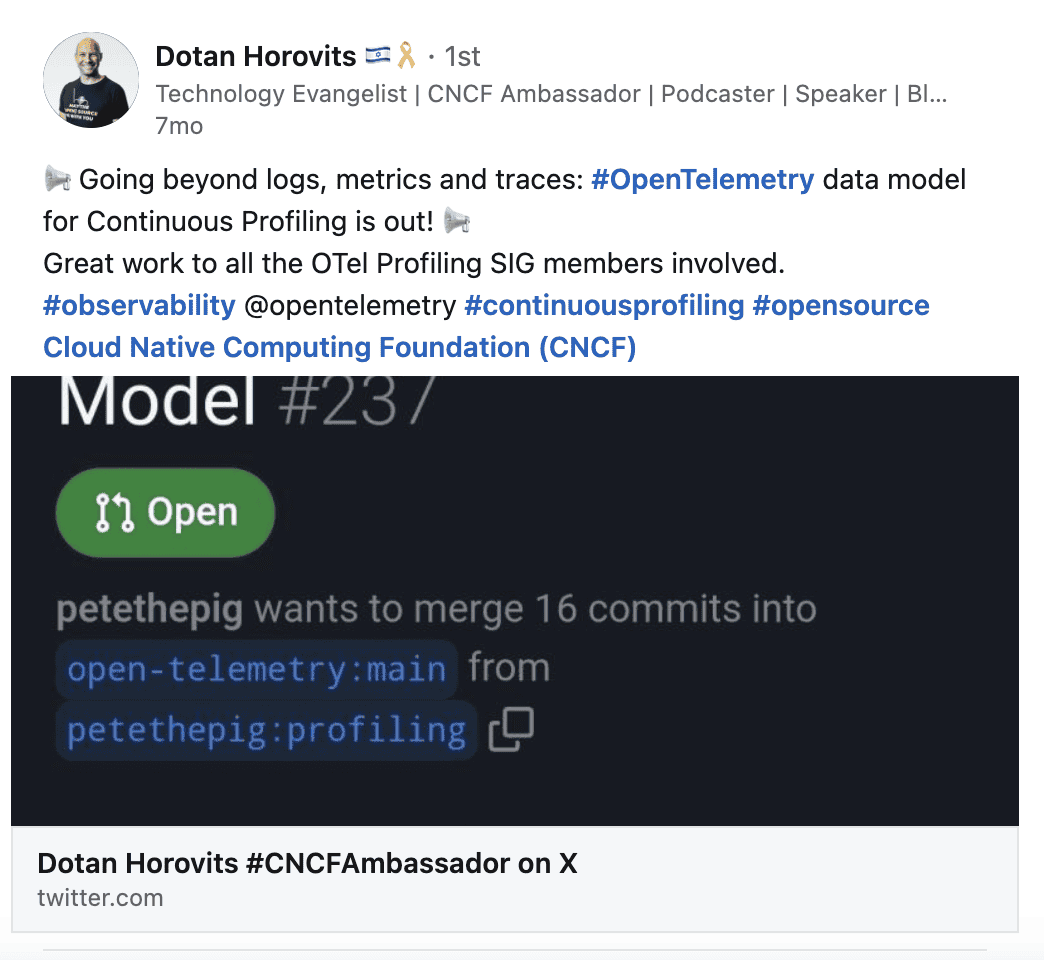
The big news is that the OTEP has been merged, and OpenTelemetry now officially supports continuous profiling, albeit still in the experimental stage. Applause to the SIG members and all the contributors on achieving this important milestone.
Want to learn more? Check out the OpenObservability Talks episode: Charting New Territory: OpenTelemetry Embraces Profiling.