
Member post by Jonathan Munz, Senior Software Engineer at Embrace
React Native allows developers to build native mobile apps using Javascript and Typescript for both iOS and Android. With a web language as its core and native deployment built-in, React Native is a great way to build feature-rich mobile apps quickly with a fast developer onboarding cycle.
Today we’ll look at different ways a React Native developer could instrument observability in their mobile app using OpenTelemetry. Why use OpenTelemetry (OTel)? The OTel project allows developers to gain key insights about their applications using standardized signals, with no vendor lock-in. The portability and extensibility of OTel’s core signals allows you to measure and improve your application, whether it’s running in a Kubernetes cluster or as an Android app in a million different hands.
The OpenTelemetry Demo project
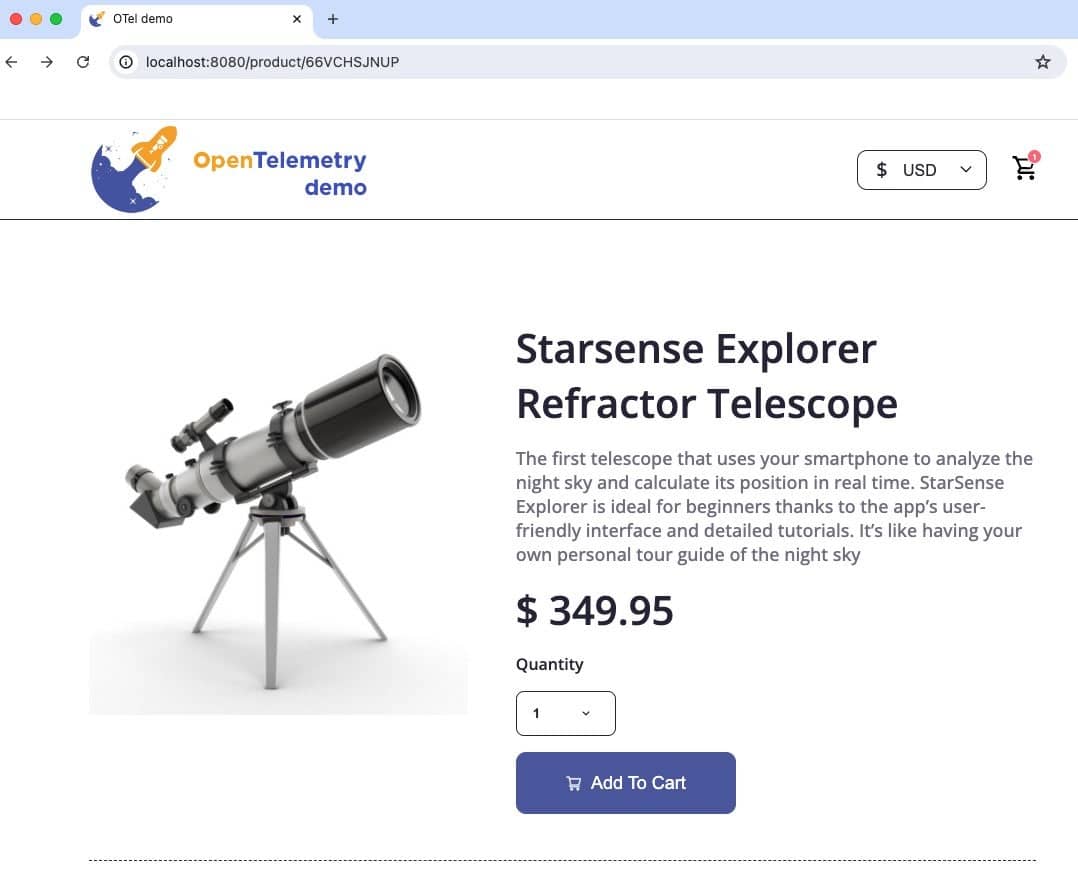
We’ll use the handy OpenTelemetry Demo as a starting point. This demo spins up a fictional “Astronomy Shop” to let you see how OpenTelemetry works on a distributed system. Currently, there is no mobile app included in the example, but if you follow the setup steps, you’ll be able to click around a storefront implemented in NextJS. The Docker instructions are probably quickest to spin up the demo, which runs at http://localhost:8080 by default:
Quick note: You can probably get away with running make start-minimal instead of make start from the demo’s Docker instructions. This will save resources, especially if you end up running the app on an emulator in the next section.
Keep reading
- If you missed OTel Community Day, read all about it
- How to find hidden OTel traces (webinar)
- Unpack the magic of distributed tracing using OTel
- Register for KubeCon + CloudNativeCon North America 2024 today
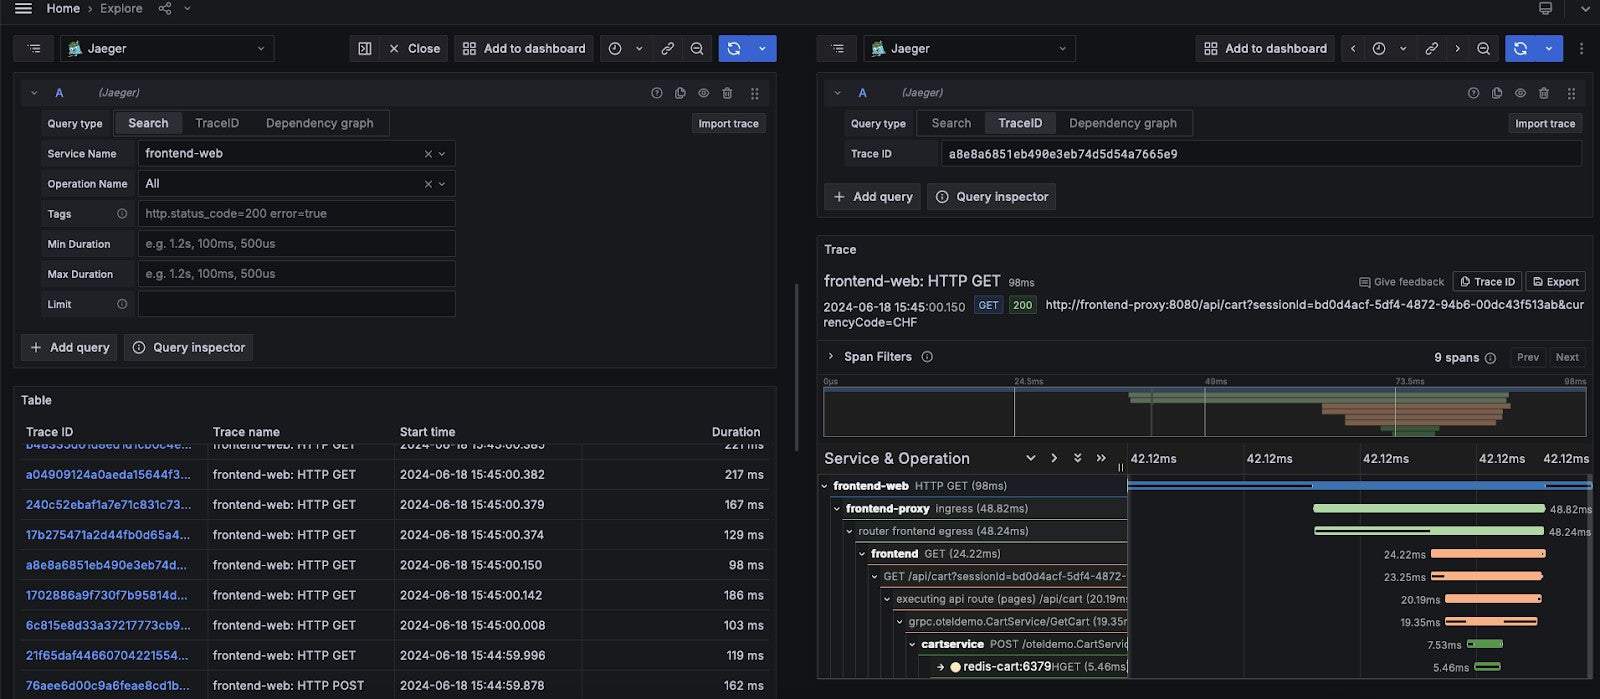
After clicking around the demo app for a bit, you can explore the telemetry it creates. For example, traces are exported to Grafana at http://localhost:8080/grafana. By going to the Explore tab and filtering for spans from the frontend service, we can see that in fact we have a number of them generated based on our actions in the demo app:
Looking deeper at the code for the web app, we see that all this telemetry was generated using OpenTelemetry packages that are being setup in FrontendTracer.ts, specifically:
- The OpenTelemetry bits needed to get the traces out to Grafana, including a Tracer Provider, Span Processor, and Exporter. A good primer on how these components fit together can be found in the OpenTelemetry docs.
- The OpenTelemetry Browser Detector package is used to capture information such as browser type and browser version and include them as part of the Resource attributes on each span.
- Auto instrumentations from the OpenTelemetry Meta Packages for Web packages automatically capture telemetry from HTTP requests, user actions, etc.
- (Note that because a Propagator was also added, the HTTP requests will contain the proper headers that allow traces to combine spans from both the client-side and backend instrumentations)
So how can we get this same telemetry if instead our storefront was implemented as a React Native mobile app? First, we’ll create a barebones app that replicates some of the functionality from the demo’s web storefront, then we’ll look at different options for adding telemetry.
Running the store app without any telemetry
On Embrace’s fork of the OpenTelemetry Demo, we added a simple React Native application which you can set up and run with:
cd src/reactnativeapp
npm install
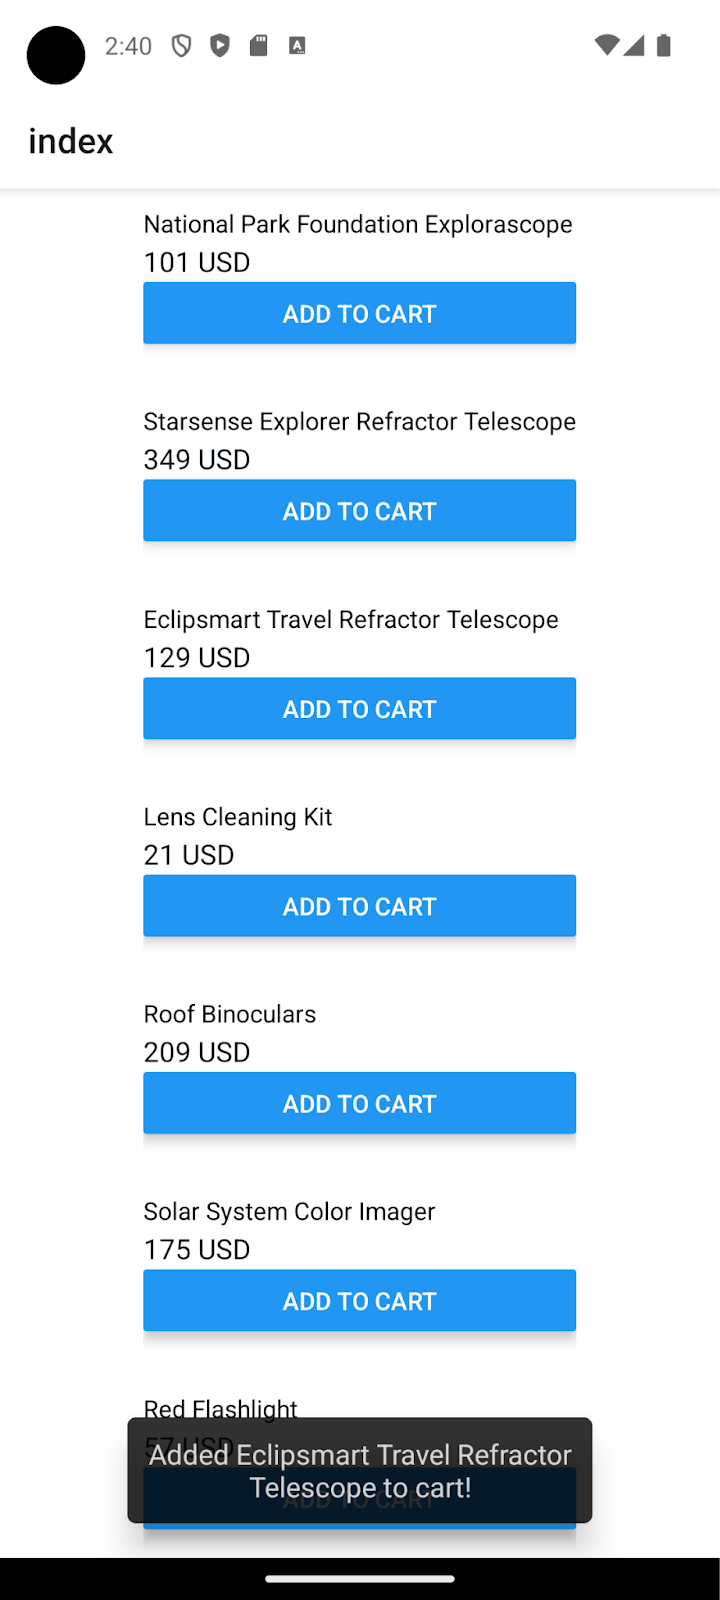
npm run android # or iosThe example only implements a subset of the web storefront, listing the products and allowing them to be added to a cart, with a simple UI:
After tapping around the store for a bit, you can check in Grafana. You should see that, while we still have spans generated from our backend services for the requests we made, they no longer show any spans from the client. We’ll have to add instrumentation to the React Native app to replace that client telemetry.
Recreating instrumentation using OpenTelemetry JS packages
To add instrumentation for the React Native app, we can replicate the important parts of the web app’s instrumentation, but in a mobile context. Specifically, we’ll need a TracerProvider, a SpanProcessor, and the Web Auto-Instrumentation. We’ll skip the browser-specific functionality as it’s no longer relevant.
Quick note: If you want to jump ahead to the completed code it is available on our OpenTelemetry Demo fork on the opentelemetry-js-example branch.
We can start by creating a Tracer function that will perform setup very similar to the FrontendTracer function we saw in the web app but with browser-specific functionality removed:
import { WebTracerProvider } from '@opentelemetry/sdk-trace-web';
import { Resource } from '@opentelemetry/resources';
import { SEMRESATTRS_SERVICE_NAME } from '@opentelemetry/semantic-conventions';

...
const Tracer = async () => {
  const resource = new Resource({
    [SEMRESATTRS_SERVICE_NAME]: "reactnativeapp",
  });
  const provider = new WebTracerProvider({ resource });

  ...
Here we’re again using the WebTracerProvider and setting up a Resource. We’re omitting the browserDetector since that won’t be relevant for our React Native app, and instead we’re just setting the service name attribute for now.
Next, we’ll add a span processor and exporter to send our traces to the OTLP-HTTP collector running in the Docker container. Note that localhost is a variable rather than just the string literal, which accounts for network differences on the Android emulator. If you’re not running the app in the emulator, you can just set it to ‘localhost’:
import { BatchSpanProcessor, SimpleSpanProcessor, ConsoleSpanExporter} from '@opentelemetry/sdk-trace-base';
import { OTLPTraceExporter } from '@opentelemetry/exporter-trace-otlp-http';

...

const localhost = await getLocalhost();
provider.addSpanProcessor(
  new BatchSpanProcessor(
    new OTLPTraceExporter({
      url: `http://${localhost}:8080/otlp-http/v1/traces`,
    }),
    {
      scheduledDelayMillis: 500,
    }
  )
);
Quick note: Any number of span processors can be added to the provider in order to layer on additional functionality. For example, you can add a unique session ID on each span, as is done in the web app. In addition, including the line: provider.addSpanProcessor(new SimpleSpanProcessor(new ConsoleSpanExporter())); is very helpful for debugging as it allows you to see each span outputted to the console as it is ended.
Next, call register on the provider to set it as the global tracer provider and allow the auto instrumentations to find it by default. As well, we’ll configure the provider to use the W3C propagators so that trace information is included as part of the HTTP headers of any instrumented request. This allows the traces to cross API boundaries:
import { CompositePropagator, W3CBaggagePropagator, W3CTraceContextPropagator } from '@opentelemetry/core';

...

provider.register({
	propagator: new CompositePropagator({
		propagators: [new W3CBaggagePropagator(), new W3CTraceContextPropagator()],
  }),
});
Finally, we’ll again make use of @opentelemetry/auto-instrumentations-web to automatically instrument our network requests. However, we’ll turn off some of the other auto-instrumentations that are web specific, such as @opentelemetry/instrumentation-user-interaction and @opentelemetry/instrumentation-document-load:
import { registerInstrumentations } from '@opentelemetry/instrumentation';
import { getWebAutoInstrumentations } from '@opentelemetry/auto-instrumentations-web';

...

registerInstrumentations({
  tracerProvider: provider,
  instrumentations: [
    getWebAutoInstrumentations({
      '@opentelemetry/instrumentation-user-interaction': { enabled: false },
      '@opentelemetry/instrumentation-document-load': { enabled: false },
      '@opentelemetry/instrumentation-fetch': {
        propagateTraceHeaderCorsUrls: /.*/,
        clearTimingResources: false,
      },
    }),
  ],
});
Making the Tracer React-friendly
At this point, we could just invoke Tracer() somewhere globally, but let’s first make it a bit more React-friendly by wrapping it in a hook:
export interface TracerResult {
  loaded: boolean;
}

export const useTracer = () : TracerResult => {
  const [loaded, setLoaded] = useState<boolean>(false);

  useEffect(() => {
     if (!loaded) {
      Tracer()
        .catch(() => console.warn("failed to setup tracer"))
        .finally(() => setLoaded(true))
    }
  }, [loaded]);

  return {
    loaded
  }
}
We’ll then hook the Tracer up within the existing logic for loading our splash screen at RootLayout, along with any other operation we want to make sure is completed before we allow user interactions with our app:
export default function RootLayout() {
  ...

  const {loaded: tracerLoaded} = useTracer();

  const loaded = useMemo<boolean>(() => tracerLoaded && otherThingLoaded && ..., [tracerLoaded, otherThingLoaded, ...])
Now we’re ready to launch the app again and add a few items to our cart. Switching back to the Grafana explore dashboard, we can do another search for spans. This time, filter for spans that include our new service.name ‘reactnativeapp’ and see what we find:
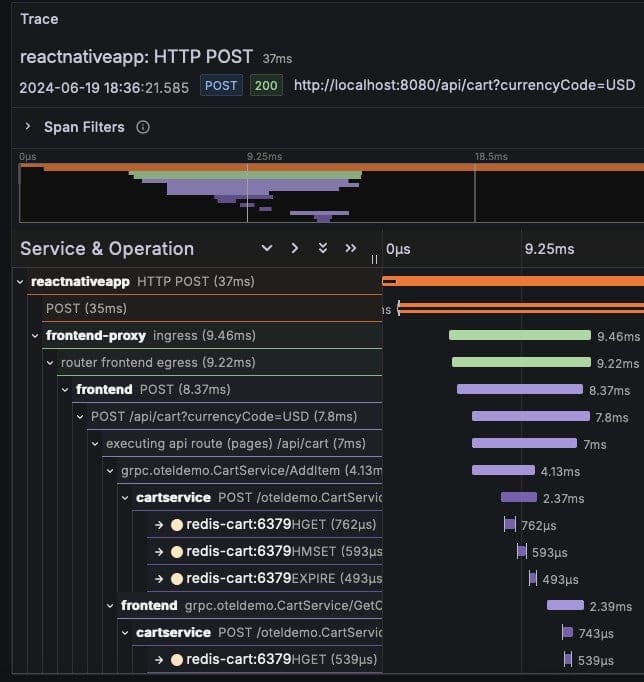
Success! Even this simple instrumentation gives us additional information about our mobile client. We can see how long requests took to complete from the client’s perspective, not just processing time on the backend. We are able to group by different services consuming our API. Most importantly, not only do we see the span for the HTTP POST request from our React Native instrumentation, but, because we’re propagating its trace ID in the request headers, that same trace includes spans from all the backend services involved in generating the response.
Adding attributes to capture mobile device context
However, the telemetry is missing some crucial attributes that we had available in the web example. Specifically, we want to see information about the mobile client itself. While we can’t use `browserDetector` to automatically grab this for us, we can include additional attributes that we have available when setting up the resource:
import { getDeviceId, getSystemVersion, getVersion } from 'react-native-device-info';
import { Platform } from 'react-native';

...

const resource = new Resource({
  [SEMRESATTRS_SERVICE_NAME]: "reactnativeapp",
  [SEMRESATTRS_OS_NAME]: Platform.OS,
  [SEMRESATTRS_OS_VERSION]: getSystemVersion(),
  [SEMRESATTRS_SERVICE_VERSION]: getVersion(),
  [SEMRESATTRS_DEVICE_ID]: getDeviceId(),
});
Quick note: It’s always best to use a key from the Semantic Conventions if one exists for the attribute you are including, so that your data plays well with analysis tools that understand OpenTelemetry. However, you are always free to add any other attribute that makes sense for your application. The more attributes you include, the more information and context you’ll have available when performing analysis downstream!
Here we’re leveraging the react-native-device-info library to pull in some additional information about the environment our mobile app is running in. If we look back at the trace in Grafana, we should now see that as part of the resource attributes:
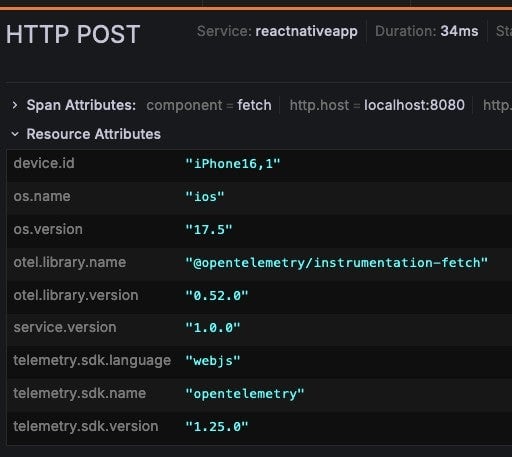
This might feel like a small change, but it actually opens up a huge capability in our observability system that we were lacking previously: the ability to analyze performance and troubleshoot issues based on the characteristics of our clients. For example, if we notice an issue suddenly pop up with one of our APIs, we can now group traces related to a specific endpoint by the version of our React Native app. This means we can potentially narrow down the root cause of the issue to a change in a specific app release.
There are some downsides to this approach. While we were mostly able to leverage the OpenTelemetry JS packages to achieve what we wanted, we had to tiptoe around the fact that the existing tooling assumes either a Node or Browser environment. Examples include assuming the existence of the web-only Performance API, or having to pass in the propagateTraceHeaderCorsUrls: /.*/ option to the fetch instrumentation, even though we are not making CORS requests from the example app.
Wrapping up
These aren’t fundamental limitations, and we can imagine a lot of these problems going away with a few contributions to the OpenTelemetry repositories. Examples include a hypothetical ReactNativeDetector that automated the resource attribute setup we did above, or an update to the instrumentation-fetch package that added fallbacks when web-specific APIs were unavailable. The nice thing with an open standard like OpenTelemetry is that development is driven by the community, so as adoption increases among React Native developers, we can expect more momentum behind improvements such as these. Embrace is helping make OpenTelemetry work for mobile developers. We’ve built our iOS and Android SDKs on OTel, while working with the community to grow the specification. This piece came as part of our discovery into mapping React Native telemetry to OTel.