Community post originally published on The New Stack by Lin Sun, Head of Open Source at Solo.io
Ambient mode is the new sidecar-less data plane introduced in Istio in 2022. When ambient mode reached Beta status in May this year, I started to see lots of users kicking the tires and running load tests to understand the performance implications after adding their applications to the mesh.
Inspired by Quentin Joly’s blog about the incredible performance of Istio in ambient mode and similar feedback from other users in the community that sometimes applications are slightly faster in ambient mode, I decided to validate these results myself.
Test environment:
I used a 3 worker node Kubernetes cluster with 256GB RAM & 32 core CPU each node.
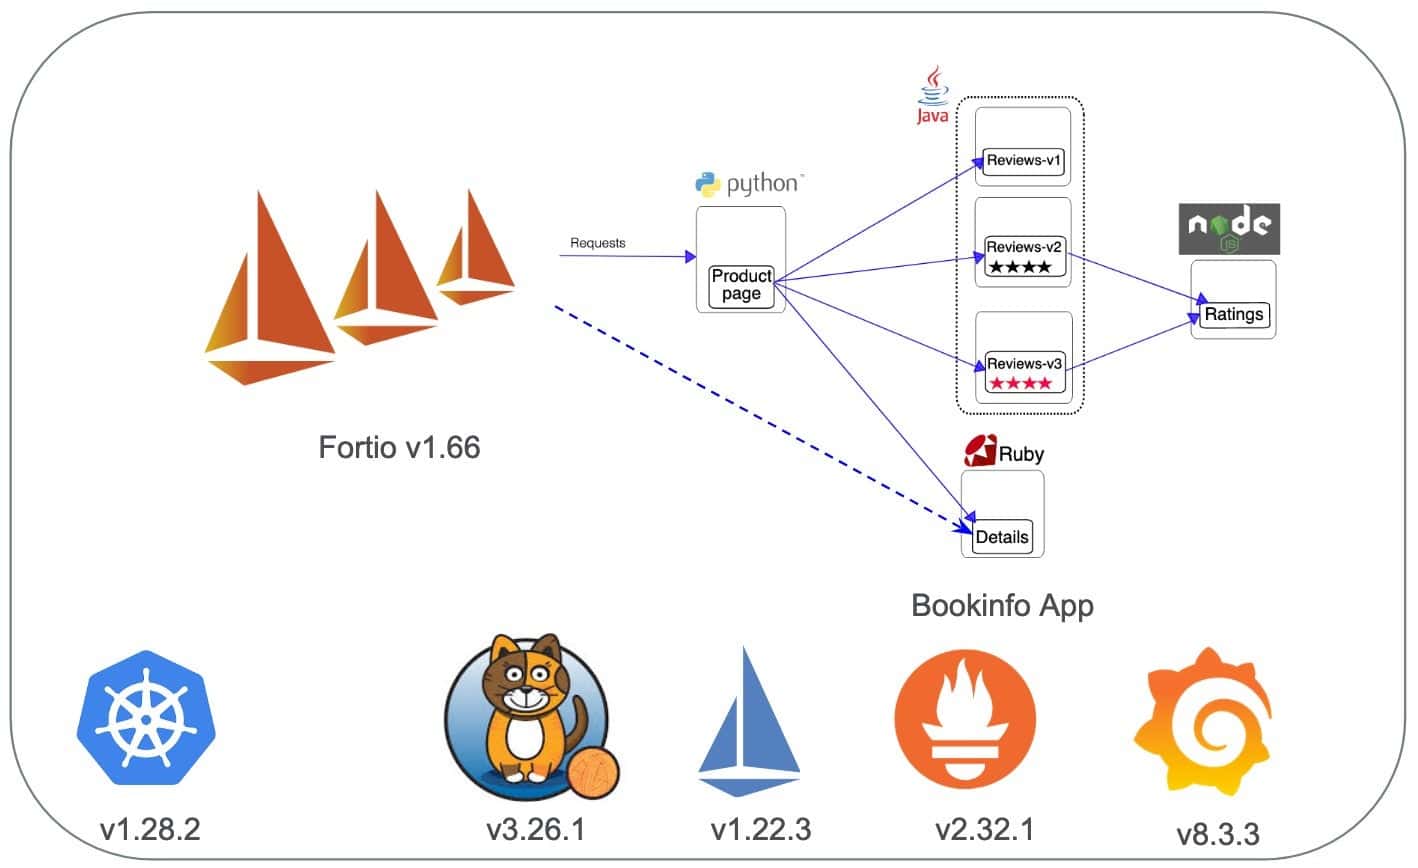
Istio uses a few tools to make consistent benchmarking easy. First, we use a load testing tool called fortio, which runs at a specified requests per second (RPS), records a histogram of execution time and calculates percentiles — e.g., P99, the response time where 99% of the requests took less than that number.
We also provide a sample app called Bookinfo, which includes microservices written in Python, Java, Node.js and Ruby.
Each of the Bookinfo deployments has 2 replicas, which are evenly distributed to the 3 worker nodes. Using a pod anti-affinity rule, I made sure that fortio was placed on a different node than the details service.
Initial Test Result
I installed the Bookinfo application from the Istio v1.22.3 release. Using the fortio tool to drive load to individual Bookinfo services (for example, details) or the full Bookinfo app, I noticed near-zero latency impact after adding everything to the ambient mesh. Most of the time they are within the range of 0-5% increase for the average or P90. I have noticed consistently that the details service in Istio ambient mode is slightly faster, just like Quentin reported in his blog.
Load testing the details service
I did the same test as Quentin, sending 100 RPS via 10 connections to the details service, and collected results for no mesh and ambient.
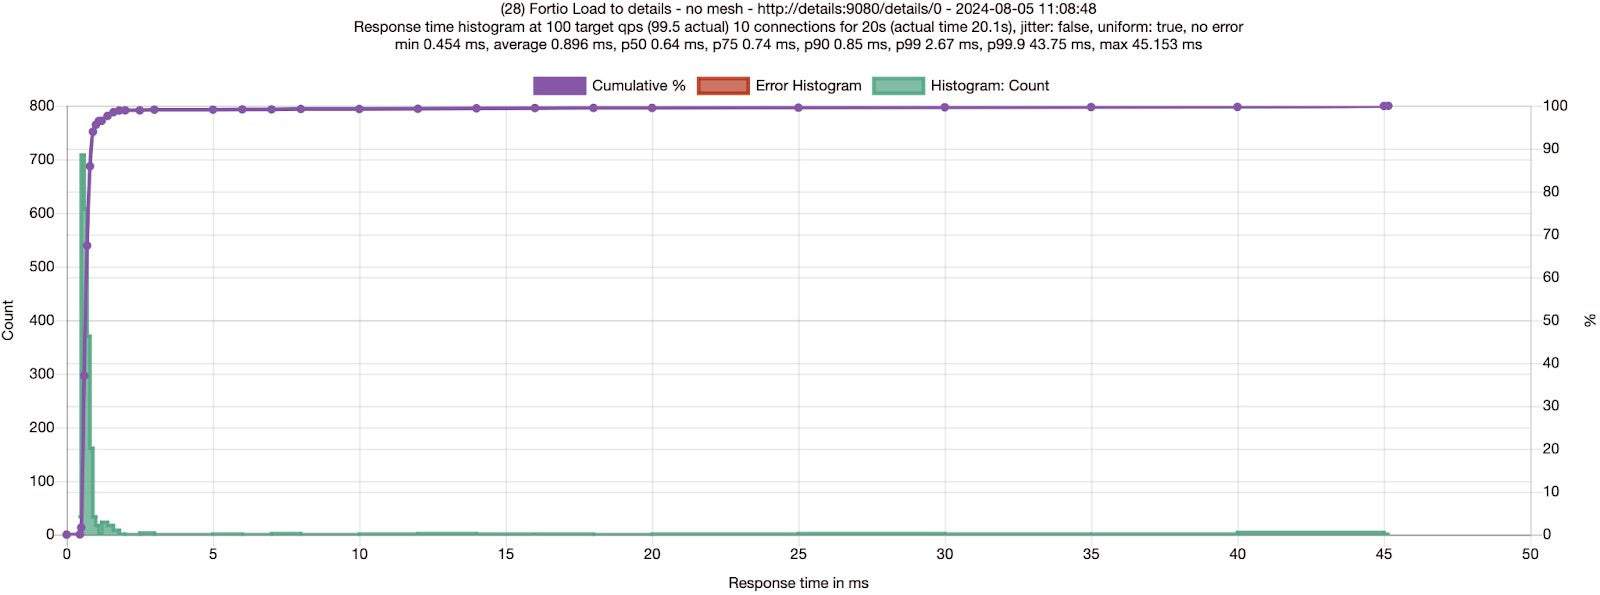
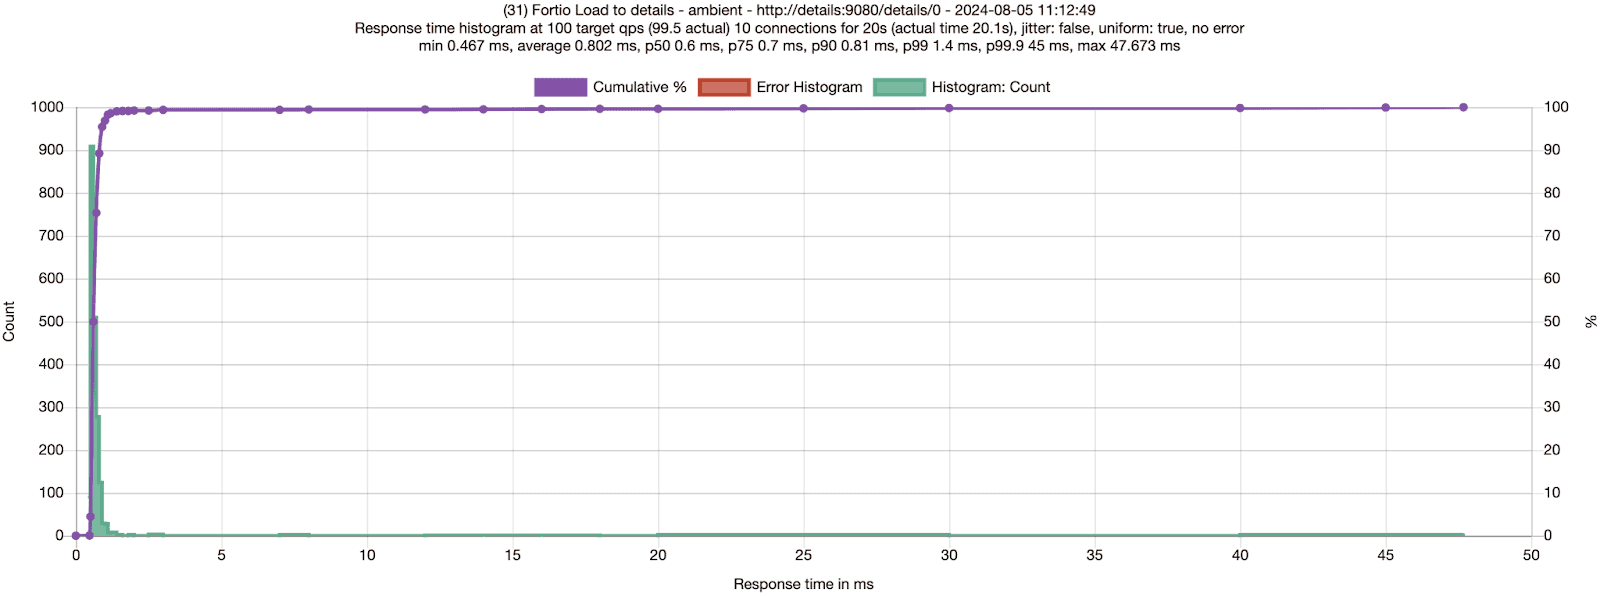
Just like Quentin, I had to run multiple tests to validate that ambient mode is slightly more performant than no mesh — which is very hard to believe! In the case of the Bookinfo details service, adding ambient mode improved latencies by 6-11% on average – as well as adding mTLS and L4 observability!
| Fortio to details | Average | P50 | P75 | P90 | P99 | Differences |
| No Mesh run 1 | 0.89ms | 0.64ms | 0.74ms | 0.85ms | 2.67ms | 11% slower on average and 5% slower for P90 |
| Ambient run 1 | 0.80ms | 0.6ms | 0.71ms | 0.81ms | 1.4ms | |
| No Mesh run 2 | 0.86ms | 0.65ms | 0.75ms | 0.86ms | 1.71ms | 6% slower on average and 4% slower for P90 |
| Ambient run 2 | 0.81ms | 0.61ms | 0.72ms | 0.83ms | 1.56ms | |
| No Mesh run 3 | 0.90ms | 0.65ms | 0.76ms | 0.88ms | 1.92ms | 10% slower on average and 5% slower for P90 |
| Ambient run 3 | 0.82ms | 0.63ms | 0.72ms | 0.84ms | 1.5ms |
Why are apps sometimes faster in the ambient mesh?
We’ve been taught that service meshes add latency. Quentin’s results, replicated here, show a case where a workload is faster when running through a service mesh. What is happening?
First theory
When your applications are in the ambient mesh, the load requests travel first through a lightweight local node proxy called ztunnel, then to the destination ztunnel, and onward to the service. The details service is using HTTP/1.1 with the Webrick library in Ruby and we have seen poor connection management and keep-alive behaviors in older or poorly configured HTTP libraries. My first hypothesis was that when the client and server are on different nodes, proxying through client and server ztunnels could actually be faster if the applications are not using efficient HTTP/2 connections. Ztunnel uses connection pooling and HTTP Connect to establish secure tunnels between nodes to leverage parallelism and HTTP/2 stream multiplexing under loads.
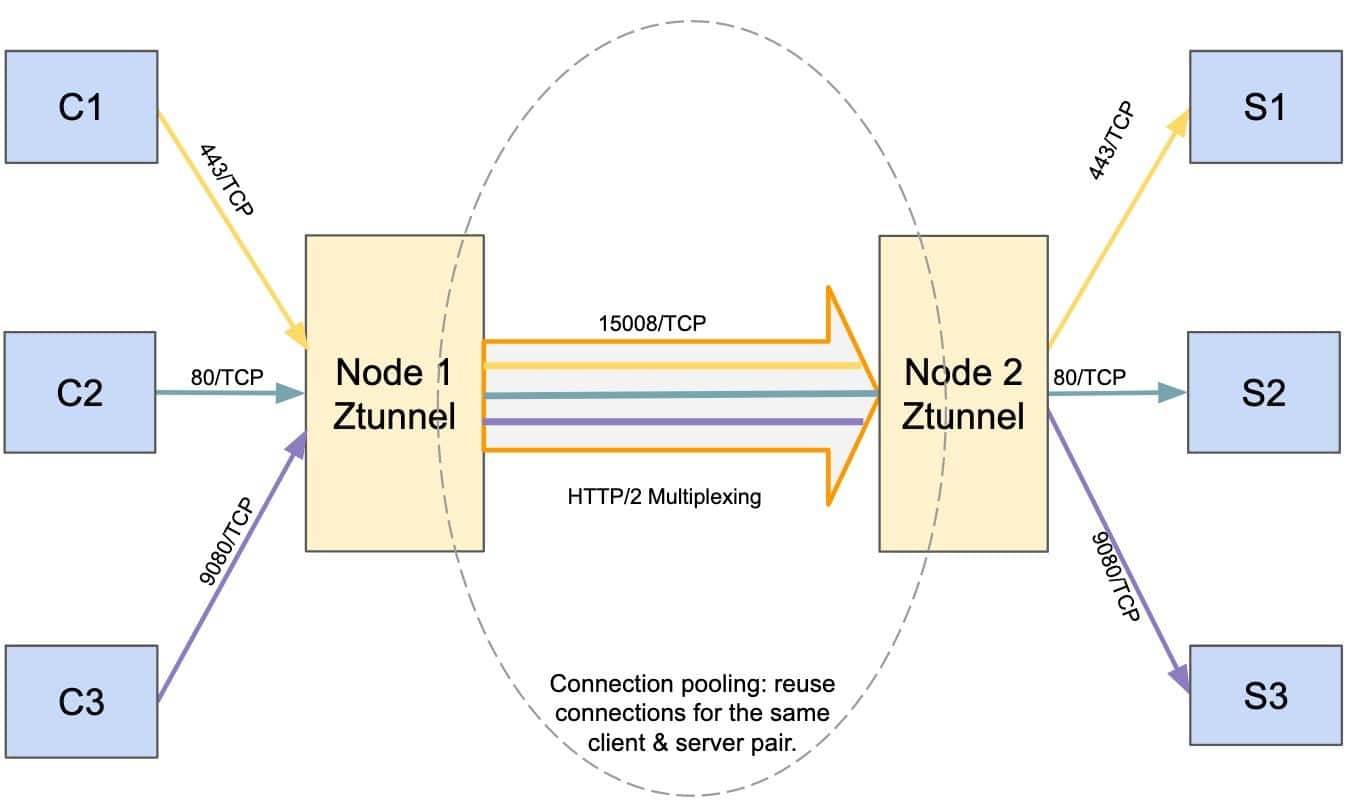
However, this theory has some challenges. Why have I only observed this consistently with the details service but not any other Bookinfo services?
Researching further, I discovered that our fortio load tool has connection keep-alive enabled by default. With 10 connections from fortio to the details service and the details service (using the WEBrick Ruby library) respects the connection keep-alive settings, the connections can be reused effectively without ambient.
Load testing with connection close
Next, I explored running the same load testing with setting the `Connection: close` header. This forcibly disables any HTTP connection pooling which is a good way to test this hypothesis.
curl -v -d '{"metadata": {"url":"http://details:9080/details/0", "c":"10", "qps": "100", "n": "2000", "async":"on", "save":"on"}}' "localhost:8081/fortio/rest/run?jsonPath=.metadata" -H "Connection: close"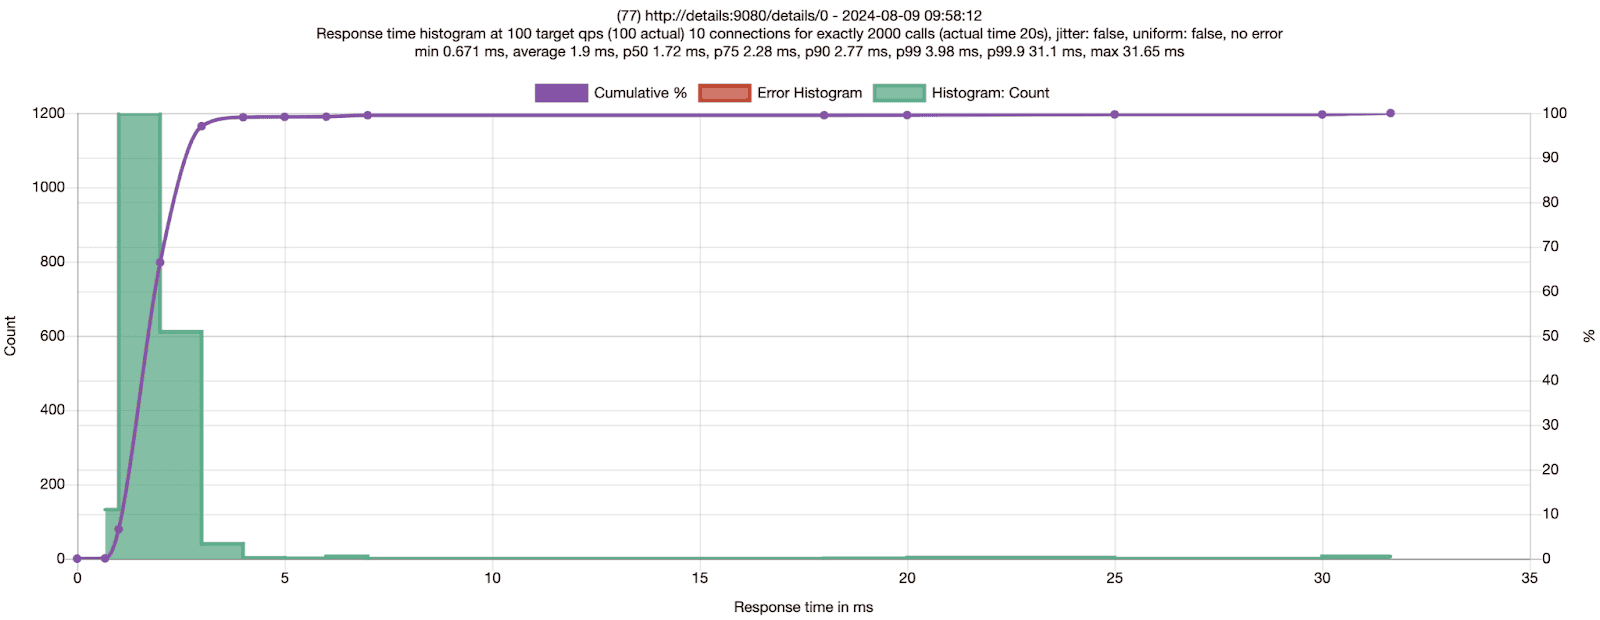
No Mesh: Fortio to the details service 100 RPS 10 connections with connection close
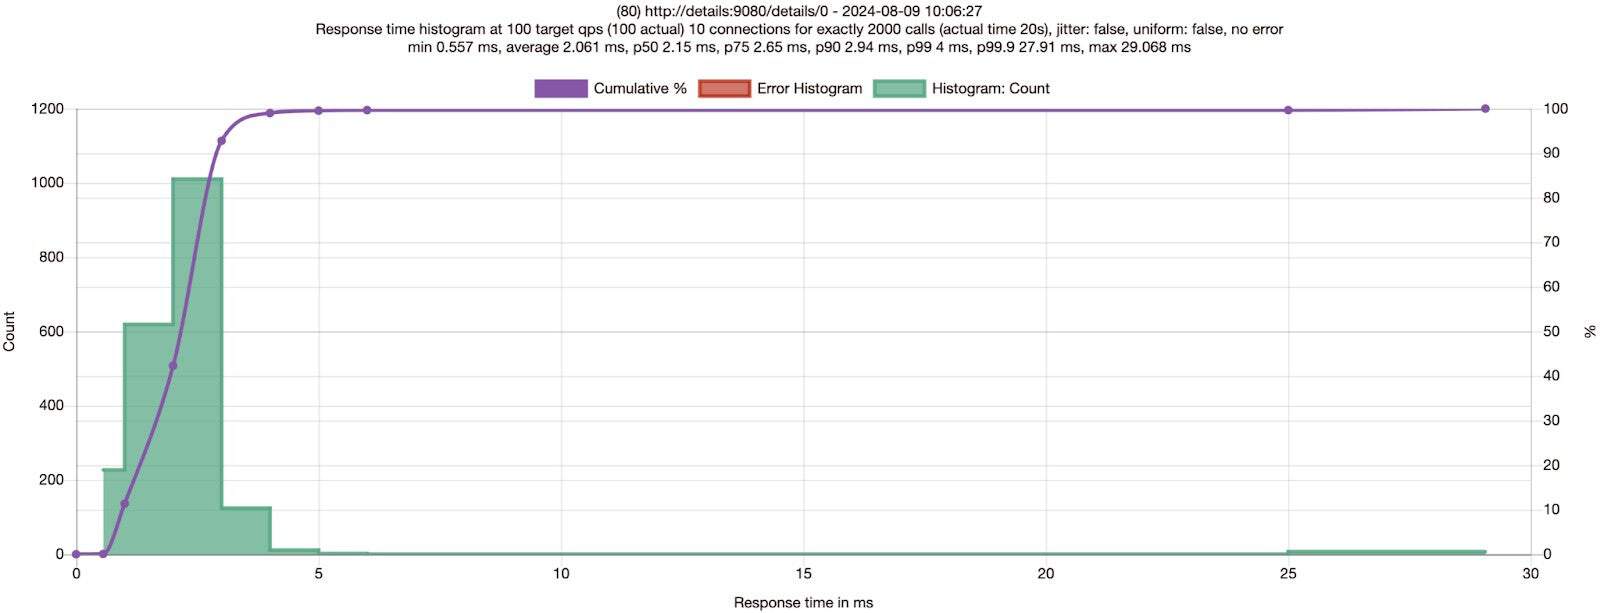
| Fortio to details | Average | P50 | P75 | P90 | P99 | Differences |
| No Mesh | 1.90ms | 1.72ms | 2.28ms | 2.77ms | 3.98ms | |
| Ambient | 2.06ms | 2.15ms | 2.65ms | 2.94ms | 4ms | 8% slower for average & 6% slower for P90 |
Compared with Table 1 results, Table 2 numbers have much higher response times, which is expected as each connection is closed immediately after each response from the details service. Given P50, P75, P90 and P99 are all slower from the ambient run with connection close, it seems safe to rule out connection pooling in ztunnel from the first theory could make requests faster.
Second theory
I noticed there is a performance-related PR from John Howard in the details and productpage services of the Bookinfo application in our new Istio v1.23 release. For the details service, the PR enabled the TCP_NODELAY flag for the details WEBrick server, which would reduce the unnecessary delay (up to 40ms) from the response time of the details service. For the productpage service, the PR enabled keep-alive on incoming requests, which will reuse existing incoming connections and thus improve performance.
With the newly updated details deployment that includes the fix, I repeated the same tests sending 100 RPS via 10 connections to the details service. The results for no mesh and ambient are really close so I ran each of the tests three times to ensure the results are consistent. Below are screenshots of the first run for each scenario:


I built a table for the three runs for each scenario:
| Fortio to details | Average | P50 | P75 | P90 | P99 | Differences | |
| 1 | No Mesh | 0.76ms | 0.58ms | 0.69ms | 0.81ms | 1.56ms | 5% slower on average and P90. 25% slower on P99 |
| Ambient | 0.72ms | 0.57ms | 0.66ms | 0.76ms | 1.24ms | ||
| 2 | No Mesh | 0.72ms | 0.59ms | 0.7ms | 0.82ms | 1.6ms | 3% slower on P90 and 18% slower on P99 |
| Ambient | 0.76ms | 0.59ms | 0.69ms | 0.8ms | 1.37ms | 5% slower on average | |
| 3 | No Mesh | 0.77ms | 0.58ms | 0.7ms | 0.8ms | 1.49ms | 1% slower on average and 8% slower on P99 |
| Ambient | 0.76ms | 0.59ms | 0.69ms | 0.81ms | 1.38ms | 1% slower on P90 | |
Compared with the previous result from Table 1, the no mesh numbers from Table 3 have improved quite a bit (more substantially at higher percentage than the ambient numbers) and are now closer to the ambient numbers. Ztunnel has TCP_NODELAY enabled by default, which contributed to the ambient performance improvement over no mesh in Table 1 when the old details service doesn’t have TCP_NODELAY enabled. When the new details service has TCP_NODELAY enabled, it has also improved the ambient response times slightly.
Table 3 also shows there is not much difference for average, P50, P75, P90 between no mesh and ambient runs for this type of load testing to the new details service with TCP_NODELAY enabled. The differences between these runs are likely noise with the exception of P99 where the no mesh is consistently 8% or more slower.
Third theory
Continue reviewing the test results from Table 3, why would there be similar latency between no mesh and ambient when there are extra hops to ztunnel pods and significant benefits provided by ambient such as mTLS and L4 observability between the fortio and details service? For the P99 case, why would the details service in the ambient mode be faster consistently?
Ztunnel provides great read/write buffer management with HTTP/2 multiplexing, which could effectively minimize or sometimes even eliminate the overhead added by the extra hops through the client and the server ztunnel pods. I decided to measure this with syscalls using strace from both the fortio and details service by getting into their Kubernetes worker nodes and attaching the pids using strace while filter out the irrelevant traces:
strace -fp {pid} -e trace=write,writev,read,recvfrom,sendto,readvThe strace output from the details service is similar for the no-mesh and ambient cases:
…
read(9, "GET /details/0 HTTP/1.1\r\nHost: d"..., 8192) = 118
write(9, "HTTP/1.1 200 OK\r\nContent-Type: a"..., 180) = 180
write(9, "{\"id\":0,\"author\":\"William Shakes"..., 178) = 178
write(2, "192.168.239.19 - - [13/Aug/2024:"..., 80) = 80
…
Output 1: No mesh or ambient – attach strace to the details service’s PID
The strace outputs from the fortio service for no-mesh vs ambient are different. In the no-mesh case we see fortio executed two reads, one for the HTTP headers and another for the body.
…
read(13, "HTTP/1.1 200 OK\r\nContent-Type: a"..., 4096) = 180
read(13, "{\"id\":0,\"author\":\"William Shakes"..., 4096) = 178
…
write(19, "GET /details/0 HTTP/1.1\r\nHost: d"..., 118) = 118
…
Output 2: No mesh – attach strace to fortio’s PID
In the ambient case we consistently see just one read for both the headers and the body.
…
read(19, "HTTP/1.1 200 OK\r\nContent-Type: a"..., 4096) = 358
…
write(19, "GET /details/0 HTTP/1.1\r\nHost: d"..., 118) = 118
…
Output 3: Ambient mesh – attach strace to fortio’s PID
Why would this happen? It makes sense that the write calls are unchanged since they are entirely based on the application behavior which is not changed in this case. Ambient coalesces these multiple application writes and converts them into a single network write and by implication a single read in the peer.
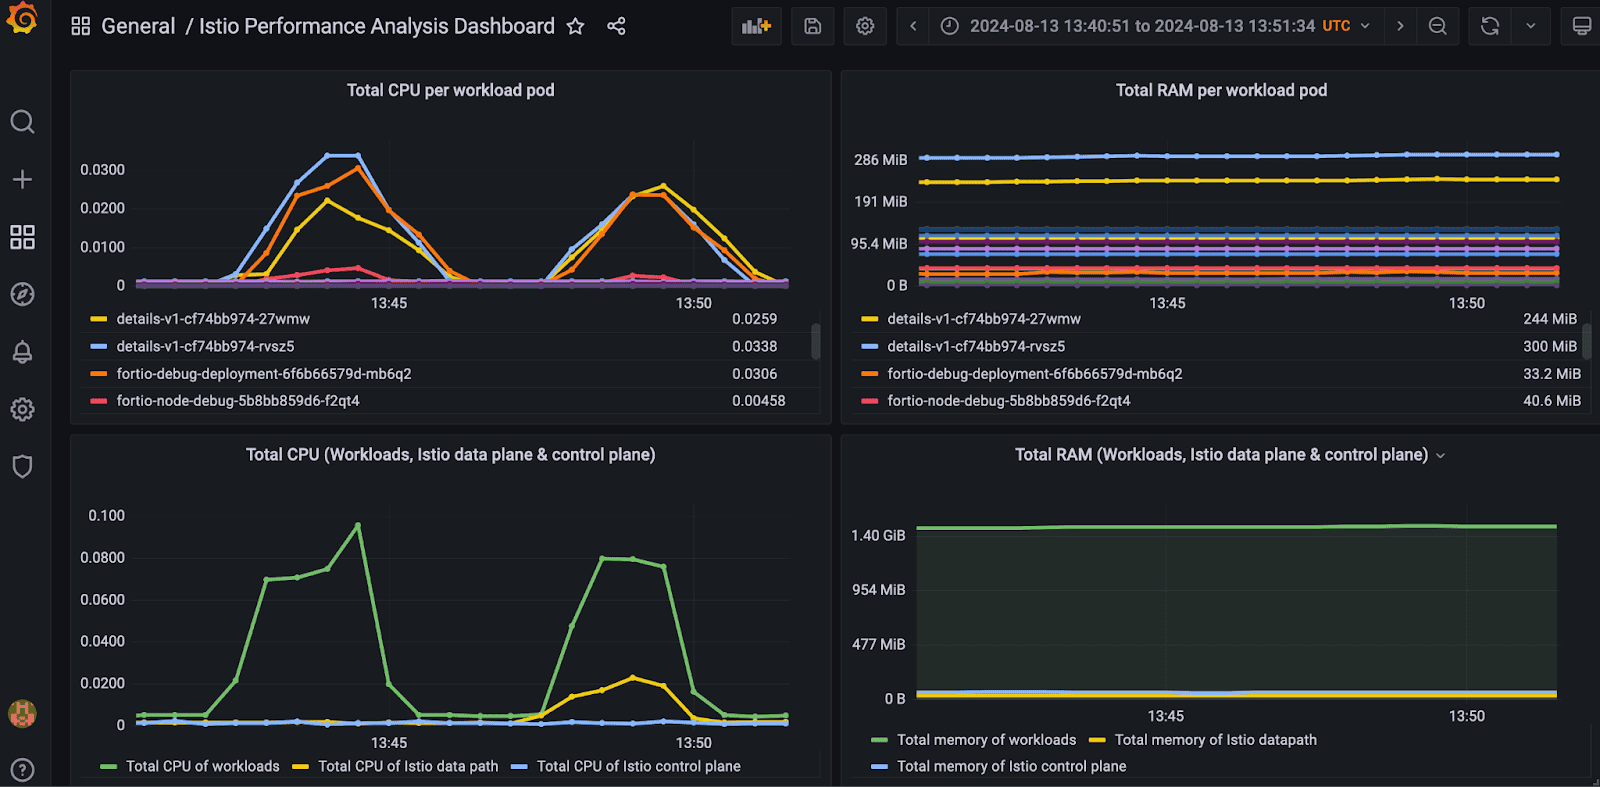
In the test scenario above I observed a 60% reduction in total syscalls by the fortio service with ambient enabled. This is very substantial and explains the majority of the improvement in latency and ~25% CPU reduction of the fortio pod at peak time with ambient. The reduction in syscalls is more than offsetting the cost of mTLS and the other features of ztunnel. I expect this pattern to be quite common in enterprise with some HTTP libraries and applications doing a better job of buffering and flushing and some not so much. Often this will correlate with the age of applications and the SDKs they were built on.
What about the entire Bookinfo application?
With the newly updated details and productpage deployments, I started with sending 1000 RPS via 100 connections to the Bookinfo application, and observed great results for no mesh and ambient.


| Fortio to Bookinfo | Average | P50 | P75 | P90 | P99 | Average Differences |
| No Mesh | 1.39ms | 1.32ms | 1.42ms | 1.67ms | 2.19ms | |
| Ambient | 1.40ms | 1.34ms | 1.48ms | 1.68ms | 2.94ms | Less than 1% slower for average and P90 |
For comparison, I also ran the same test against the old Bookinfo sample shipped in v1.22.3, and you can see that the new Bookinfo made 5-10X improvements on response times, for either no mesh or ambient!
| Fortio to Bookinfo | Average | P50 | P75 | P90 | P99 | Average Differences |
| No Mesh | 6.35ms | 4.68ms | 7.44ms | 11.4ms | 36.63ms | |
| Ambient | 6.74ms | 4.9ms | 7.79ms | 12.12ms | 41.14ms | 6% slower |
Increased the load to 4000 RPS with 400 connections with the new Bookinfo deployments:


The response times are still very good, way better than the old Bookinfo app with only 1000 RPS and 100 connections (Table 5):
| Fortio to Bookinfo | Average | P50 | P75 | P90 | P99 | Average Differences |
| No Mesh | 1.54ms | 1.33ms | 1.54ms | 2.25ms | 3.98ms | |
| Ambient | 1.58ms | 1.37ms | 1.57ms | 2.33ms | 4.9ms | 3% slower on average and 4% slower on P90 |
It is really nice to see that Bookinfo handles 4000 RPS without any errors and ambient mode is about 3-4% slower than no mesh with all the benefits of encryption in transit with mTLS and L4 observability. I recall I could only reach up to 1200 RPS with the old Bookinfo app, which already resulted in a small percentage of errors. Now I can increase loads to 4000 or higher RPS without errors.
Wrapping up:
Ambient mode at L4 introduces only a very tiny impact — and occasionally even an automatic improvement! — to users’ application latencies. Combined with the simple UX by labeling the namespace to enroll your application to ambient without restarting any workloads, it provides a delightful experience to users that we intended when we initially named it ambient.
I would like to thank all of our Istio maintainers who built such a delightful project and CNCF for providing the Istio project access to the infrastructure lab where I performed the test. I would also like to thank Quentin Joly and many users who provided me with the “ambient is slighter faster than no mesh sometimes” feedback which triggered me to run the above benchmark tests to experience the improvement or tiny latency impact under load for myself.