


Ambassador post originally published on Medium by Dotan Horovits, CNCF Ambassador
TL;DR Key updates:
- Breaking Changes and OpenTelemetry Compatibility
- A Facelift for Prometheus UI
- Remote Write 2.0 and Archive of OpenMetrics
- New Governance: Making Prometheus More Inclusive
- Native Histograms and Performance Improvements.
- Prometheus Ecosystem Updates: Thanos, Perses and More
PromCon Europe 2024 just wrapped up in Berlin, and this year’s edition was a big one. Not just because the Prometheus community gathered in full force, but also because we got the long-anticipated unveiling of Prometheus 3.0! The maintainers literally hit the ‘merge’ button for 3.0-Beta on stage!
For the occasion, I sat down with Julius Volz, the creator of Prometheus, for a walk through the major announcements and what they mean for the future of the Prometheus ecosystem. I’ll recap the highlights in this blog, and you can find the full fireside chat on the latest episode of OpenObservability Talks:
Major release: Breaking Changes and OpenTelemetry Compatibility
Prometheus v2 has been around for almost 7 years, with no less than 54 minor releases. It was high time to bump that major release. Major versions are also the time that software usually has breaking changes, and Julius says this was indeed part of the reason for this major release. So should we expect things to break when we upgrade from 2.x to 3.0?
The good news, according to Julius, is that for most people, when they upgrade from 2.x to 3.0, nothing much will break. He said it was about getting rid of “old crafty stuff”, primarily removing deprecated experimental feature flags, so the majority of users should not experience any breaking changes. Don’t worry, Prometheus keeps its longstanding backwards-compatibility commitment to its users.
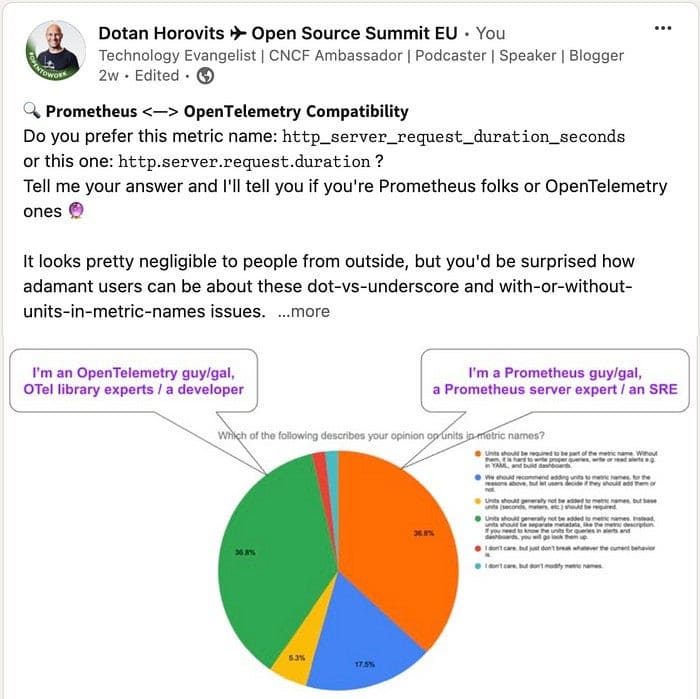
This major release is not just about incremental changes — it represents a shift in how Prometheus will be used moving forward. Julius explained that one of the major themes for v3.0 is OpenTelemetry (OTel) compatibility. This is not trivial, given different design principles employed by each project around metric naming (dots or underscores? with or without units?) and encoding (UTF-8 now supported on Prometheus v3), pull vs. push mode, delta vs. cumulative temporality, and more. But there’s a clear upside to it.
Prometheus has always been known for its robust metric collection, but with the move to support native OpenTelemetry metrics, Prometheus maintainers want to position it as the go-to backend for OpenTelemetry. This is a strategic step to make Prometheus more interoperable and future-proof as OpenTelemetry continues to gain adoption across the industry.
A Facelift for Prometheus UI
We also discussed the revamping of the Prometheus UI. While Prometheus has traditionally been loved for its backend performance and flexibility, the frontend has sometimes lagged behind. Julius walked us through how the new UI in 3.0, which he developed himself, will improve usability without sacrificing the core simplicity that Prometheus users value. It’s based on Mantine, a modern React component library, and achieves a slick and cleaner look.
The new Prometheus UI also offers new functionality, including a PromLens-style tree view, a better metrics explorer and an “Explain” tab. The revamped metrics explorer enables easy visual exploration of metrics and their labels, cardinality and more. The tree view was inspired by PromLens, a PromQL query builder tool which was recently donated to Prometheus.
To my question, Julius said that the Alertmanager UI is not being touched at the moment, and he’s not sure when that would happen. He did confirm that the goal is to adopt the same UI framework (currently it’s not even React-based) and look and feel, as the revamped Prometheus UI. For more on the new UI, check out Julius’s blog post.
Remote Write 2.0 and Archive of OpenMetrics
One of the standout features of Prometheus 3.0 is Remote Write 2.0. Remote Write format serves to transmit bulk metrics from Prometheus to analytics backends. Julius shared insights into how this new iteration of remote write enhances the way Prometheus handles long-term storage. Prometheus, by design, is all about short-term, high-performance metric collection. But the ecosystem has evolved to handle long-term storage solutions like Thanos, Cortex, and Mimir, which integrate with Prometheus.
With Remote Write 2.0, the focus is on reliability and efficiency. It drastically reduces the chance of data loss during network outages or downtime and allows for better streaming of data to remote storage. This is a big leap forward for teams that rely on Prometheus for critical monitoring and need bulletproof data pipelines.
Also important is the exposition format, which defines how metrics are exposed by different components for scraping by Prometheus. A while back this format was spun off into its own project called OpenMetrics, in hope of making it into an independent standard. This hasn’t succeeded, and cluttered the Prometheus ecosystem. Now OpenMetrics is officially archived and merged back into Prometheus, where it belongs.
Native Histograms and Performance Improvements
Another exciting feature coming with Prometheus 3.0 is the introduction of native histograms. This feature significantly enhances how Prometheus can handle high-cardinality data, making it easier to manage large data sets without sacrificing performance.
With v3.0, native histograms now support out-of-order ingestion, which addresses various scenarios brought up by OpenTelemetry, and more broadly by networking and similar disconnect and temporary gaps in metric data, a gap that that can now be filled.
By natively supporting histograms, Prometheus 3.0 reduces the complexity of metric aggregation and makes queries faster and more efficient. It’s one of those under-the-hood improvements that might not make headlines, but it will have a big impact for users at scale.
Prometheus Ecosystem Updates: Thanos, Perses and More
We couldn’t talk about Prometheus without touching on the broader ecosystem. One important open source project in the Prometheus ecosystem is Thanos, which offers long-term scalable storage for Prometheus. Similar to Cortex and Mimir, Thanos is introducing native multi-tenancy support, enabling sending data from different tenants, and then tracking and controlling access to it by tenant.
Another interesting development in Thanos is distributed query execution, which improves query performance by pushing some of the processing down to leaf nodes, in a hub-and-spoke (or map-reduce) fashion.
On the visualization side, one of the interesting developments coming out of PromCon this year was Perses project that recently joined the CNCF. Julius hinted that while Grafana has been the default for many, Perses is offering a lightweight, Prometheus-native dashboarding experience, with GitOps capabilities and foundational open source philosophy. Perses is still in its early days, but it’s worth keeping an eye on as it evolves.
New Governance: Making Prometheus More Inclusive
As Prometheus continues to grow, the governance model has also undergone changes. We touched on the project’s shift to a more formalized governance structure, lowering the barrier to entry for people to get involved, and making it easier for contributors to reach key positions in the project and collaborate on the future of Prometheus. This move aligns with other CNCF projects that have embraced more structured, tiered, transparent governance models as they mature.
Julius pointed out that with Prometheus now being used by countless organizations, it was important to ensure that decisions about its direction are made inclusively. The new governance framework will offer more tiers and empower a broader community to get more responsibility, accountability and permissions, and ultimately influence the roadmap while maintaining the high standards that have made Prometheus a cornerstone of the observability space.
Looking Forward: The Future of Prometheus and the Ecosystem
PromCon was full of updates, such as automatic reloading of the Prometheus configuration, Regex and query functionality, the new Service Discovery Manager, and the Agent mode reaching Stability, and we couldn’t cover it all here.
The 3.0 Beta is out and you’re welcome to try it out and check the release notes. The Prometheus 3.0 GA release is expected towards KubeCon North America 2024 in November, according to the outcomes of the Prometheus maintainers’ DevSummit that followed PromCon.
As we wrapped up our discussion, Julius emphasized that while Prometheus 3.0 is a huge milestone, the work is far from over. The team is already looking ahead to what’s next, including improvements to scalability, deeper integrations with OpenTelemetry, and continued enhancements to the overall user experience.
PromCon Europe 2024 was a reminder of just how far Prometheus has come. With the launch of Prometheus 3.0, the project is poised to remain a dominant force in the observability ecosystem for years to come.
Want to learn more? Check out the OpenObservability Talks episode: Prometheus 3.0 Unveiled: PromCon Highlights with Julius Volz