Community post originally published on Medium by Giorgi Keratishvili

Introduction
If you have worked on Kubernetes production systems at any time during the last 10 years and needed to check your pods or application uptime, resource consumption, HTTP error rates, and needed to observe them for a certain period of time, most probably you have been using the Prometheus and Grafana stack. If you want to extend your knowledge of observability and monitoring, then this exam is exactly for you because it does not focus only on Prometheus but also on general concepts such as SLA, SLO, SLI, how to structure alerting, and best practices for observability.
Besides that, Prometheus is one of the first open source projects that joined the CNCF after Kubernetes and has since been one of the most preferred tools for monitoring and observability in containerized environments. It also incorporates other open source projects such as Grafana for visualization and OpenTelemetry for observability, which greatly impact the whole industry.
Who should take this exam?
As mentioned above, the majority of the time we see Prometheus in Kubernetes or containerized environments, but nonetheless, it is not limited only to containerized scenarios. Overall, if we have any production system, we must have some kind of monitoring tool. If we don’t have observability, we are blind and when things go wrong — and they will — it’s just a matter of time before it happens, you will appreciate that you could see more and on time everything.
Regarding persons who would benefit SysAdmins/Dev/Ops/SRE/Managers/Patform engineers or anyone who is doing anything on production should consider it.

Exam Format and PSI Proctored Exam Tips
So, are we fired up like a torch, eager to spot any degradation in your systems and wanting to pass the exam? Then, we have a long path ahead until we reach this point. First, we need to understand what kind of exam it is compared to CKAD, CKA, and CKS. This is the first exam where the CNCF has adopted multiple-choice questions, and compared to other multiple-choice exams, this one, I would say, is not easy-peasy. However, it is still qualified as pre-professional, on par with the KCNA and KCSA.
This exam is conducted online, proctored similarly to other Kubernetes certifications, and is facilitated by PSI. As someone who has taken more than 15 exams with PSI, I can say that every time it’s a new journey. I HIGHLY ADVISE joining the exam 30 minutes before taking the test because there are pre-checks of ID, and the room in which you are taking it needs to be checked for exam criteria. Please check these two links for the exam rules and PSI portal guide
You’ll have 90 minutes to answer 60 questions, which is generally considered sufficient time. Be prepared for some questions that can be quite tricky. I marked a couple of them for review and would advise doing the same because sometimes you could find a hint or partial answers in the next question. By this way, you could refer back to those questions. Regarding pricing, the exam costs $250, but you can often find it at a discount during Black Friday promotions or near dates for CNCF events like KubeCon, Open Source Summit, etc.

The Path of Learning
At this point, we understand what we have signed up for and are ready to dedicate time to training, but where should we start? Before taking this exam, I had a good experience with Kubernetes and its ecosystem and had experience with Prometheus but only for things that I needed. I did not delve deeper, yet I still learned a lot from this exam.
Let break down Domains & Competencies
**Observability Concepts 18%**
    Metrics
    Understand logs and events
    Tracing and Spans
    Push vs Pull
    Service Discovery
    Basics of SLOs, SLAs, and SLIs

**Prometheus Fundamentals 20%**
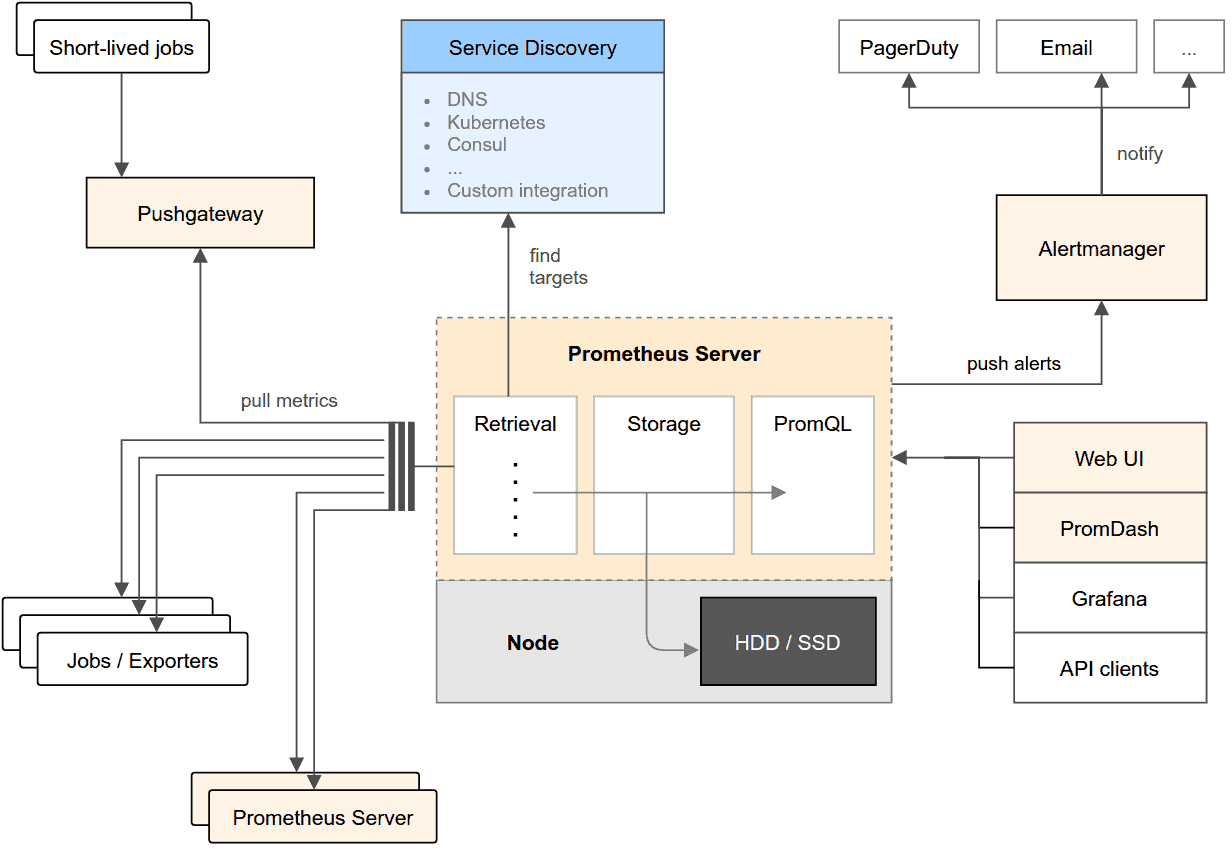
    System Architecture
    Configuration and Scraping
    Understanding Prometheus Limitations
    Data Model and Labels
    Exposition Format

**PromQL 28%**
    Selecting Data
    Rates and Derivatives
    Aggregating over time
    Aggregating over dimensions
    Binary operators
    Histograms
    Timestamp Metrics

**Instrumentation and Exporters 16%**
    Client Libraries
    Instrumentation
    Exporters
    Structuring and naming metrics

**Alerting & Dashboarding 18%**
    Dashboarding basics
    Configuring Alerting rules
    Understand and Use Alertmanager
    Alerting basics (when, what, and why)
At first glance, this list might seem too simple and easy; however, we need to learn the fundamentals of observability first in order to understand higher-level concepts.
Understanding Observability
Observability is a measure of how well the internal states of a system can be inferred from knowledge of its external outputs. In the context of system engineering and IT operations, observability is crucial for diagnosing issues and ensuring that all parts of the system are functioning as expected.
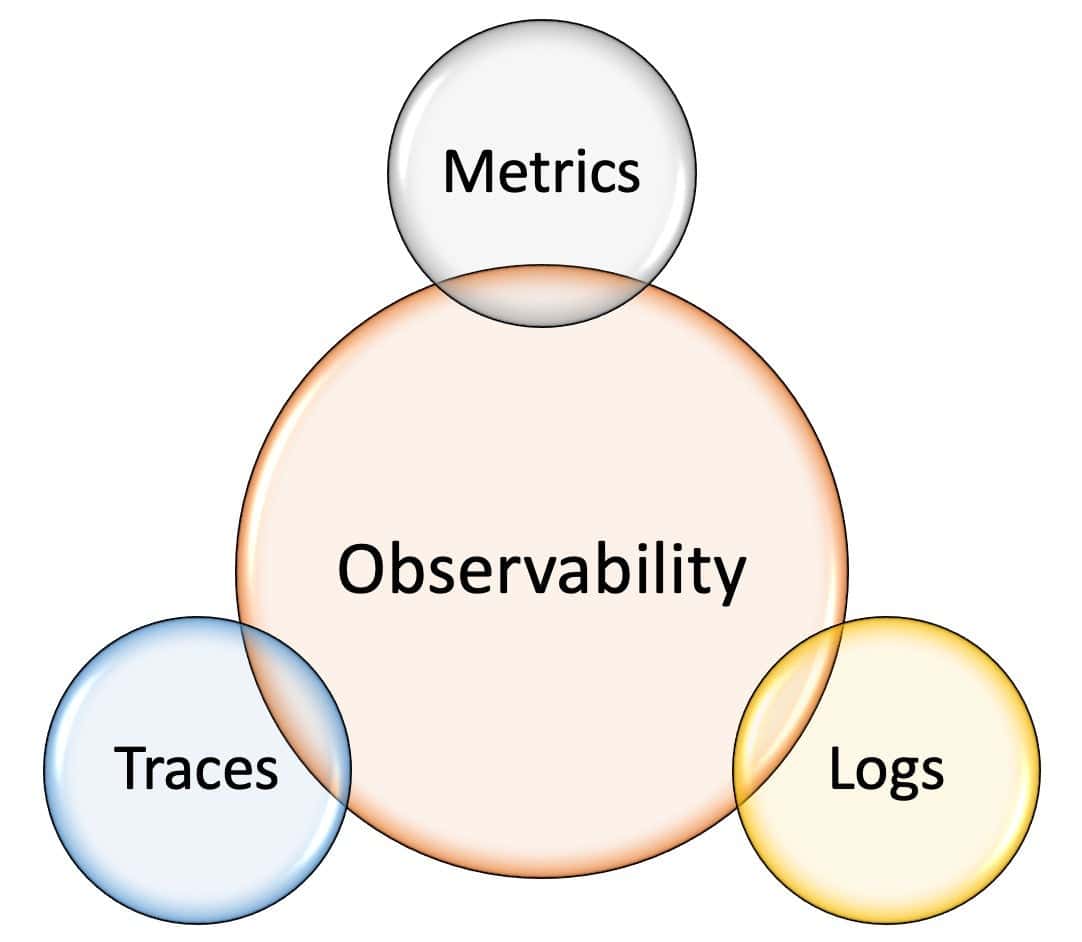
The Pillars of Observability
- Logs: These are immutable records that describe discrete events that have happened over time. Logs are useful for understanding what happened in a system after an event.
- Metrics: These are numerical values that measure some aspect of a system over intervals of time. Metrics are vital for understanding the performance of a system and for making comparisons over time.
- Traces: These are records of the full paths or sequences of events that occur as requests flow through a system. Tracing helps in identifying how requests propagate through a system and where delays or issues arise.

Some Key Concepts to Remember:
- SLA (Service Level Agreement): An SLA is the agreement you establish with your clients or users, defining the level of service they can expect.
- SLO (Service Level Objective): SLOs are specific, measurable goals your team must achieve to meet the SLA. They represent the performance targets you aim to reach.
- SLI (Service Level Indicator): SLIs are the actual metrics or measurements that indicate the real-time performance of your system. They are used to assess compliance with SLOs.
- Pull: Metric scraping is initiated by Prometheus. Prometheus queries target endpoints to collect metrics at regular intervals.
- Push: Metrics are published by the application to an endpoint (e.g., Pushgateway). This method allows applications to push metrics when they are generated.
- Trace: A trace represents a sequence of operations that together form a unique transaction handled by an application and its constituent services. Traces help in understanding the flow of requests and identifying bottlenecks or issues in your system.
- Span: A span, in the context of tracing, represents a single operation within a trace. It provides detailed information about the duration and context of that operation.
- Rule Types: In Prometheus, there are two types of rules. Record rules help precompute frequently needed or computationally expensive expressions, while alert rules enable you to define alert conditions using PromQL queries.
- Meta-Monitoring: Comprehend the concept of meta-monitoring, which involves monitoring the Prometheus instances themselves.
Key Learning Objectives:
- PromQL: PromQL is pivotal you can put your skills to the test by exploring metrics here and delving into Prometheus’s basic system architecture here. Additionally, grasp the fundamentals of Prometheus’s basic functions here.
- AlertManager: You need to understand AlertManager and its functionalities are crucial. Gain insights into AlertManager features here and visualize your AlertManager routes here.
- Exporters: Familiarize yourself with exporters like node_exporter and blackbox_exporter.

You can explore and learn about PCA Certification and related topics freely through the following GitHub repositories which I have used
- walidshaari/PrometheusCertifiedAssociate
- edgarpf/prometheus-certified-associate
- Al-HusseinHameedJasim/prometheus-certified-associate
- https://github.com/edgarpf/prometheus-certified-associate
For structured and comprehensive PCA exam preparation, consider investing in these paid course from KodeKloud where they providy play ground I used it in preparation and it helped a lot
- KodeKloud PCA Certification Course
- https://training.promlabs.com/trainings/
- https://robustperception.teachable.com/p/introduction-to-prometheus
Conclusion
The exam is not easy among other certs. I would rank it in this order KCNA/CGOA/CKAD/PCA/KCSA/CKA/CKS. After conducting the exam, you will receive grading within 24 hours and after passing the exam it feels pretty satisfying. Overall, I hope it was informative and useful 🚀
