Community post originally published on Dev.to by Sunny Bhambhani
Introduction
k9s is a terminal based GUI to manage any Kubernetes(k8s) cluster. Using this single utility, we can manage, traverse, watch all our Kubernetes objects.
More information around k9s can be found here: https://k9scli.io/
We will dive a bit into k9s and see how it can help us in our day-to-day life, how we can get started, etc.
Features
Before we go into the example on how it can help, what it can do for us, let’s see some of its features, it has a ton of features, but we will focus on the ones which can help us in our day-to-day activities:
- Shows a helicopter view of all the Kubernetes objects.
- Easily we can move from one namespace to another.
- Watch/observe the state of Kubernetes objects using
pulses. - Get the
treekind of structure usingxraysto identify objects co-relation. - Manage the objects directly from the CLI, operations like deleting, editing, restarting is just one button away.
- Interestingly using a single button, you can get shell access to the pods.
- Check the logs from any of the pod without actually remembering the name of the pod, just select the pod and the logs are just one button away.
- Sanitize/clean up all the pods which are in completed/error state.
- …. and a lot more.
Installation
- Its installation is straight forward and is available for almost all the platforms.
- Refer https://k9scli.io/topics/install/ for more details.
- We will be doing this on Ubuntu.
Download the latest version of k9s binary, you can use the same URL/version if required or get the latest version released and update below URL accordingly.
For latest version, refer: https://github.com/derailed/k9s/releases
$ wget https://github.com/derailed/k9s/releases/download/v0.32.7/k9s_linux_amd64.debInstall it using apt package manager.
$ sudo apt install ./k9s_linux_amd64.debOnce done it will get the k9s binary installed here: /usr/bin/k9s.
HOWTO
Launch k9s
$ k9s
Once k9s is launched you will be presented with a beautiful layout with lots of options.

- Press 0 to view all the pods from all the namespaces.
Navigate between Kubernetes objects
Navigating is pretty easy; it is more or less like vi or vim.
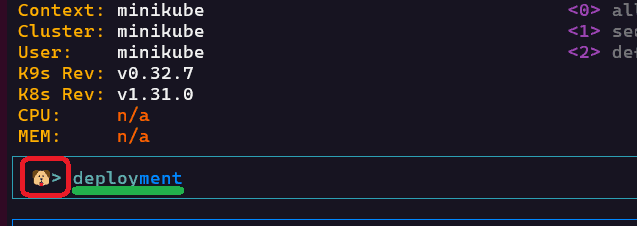
- For example, if you want to view deployments then press
:it will bring the cursor to a text area where you can write the object that you are interested in, for instance in current example deployments. - The short forms too are accepted i.e. deploy in case of deployment, svc in case of service, etc.
- This also supports crds 🙂
Pods management
- Press
:and type in pods, it will show you all the pods in selected namespace, if you want to see the pods from all namespaces press0.

- There are times where we have to delete the pods on the fly. Just select the pod and press
ctrl+dand you are done.

- There are times when you have to login to a pod. Just select the pod and press
sand you are done. If you want to exit, pressctrl+dor type inexit.

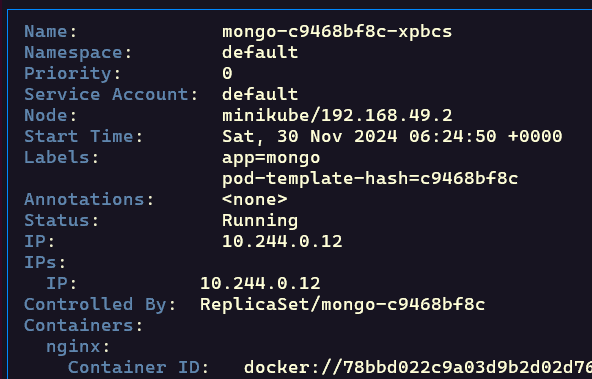
- Want to describe the pod details, press
d.
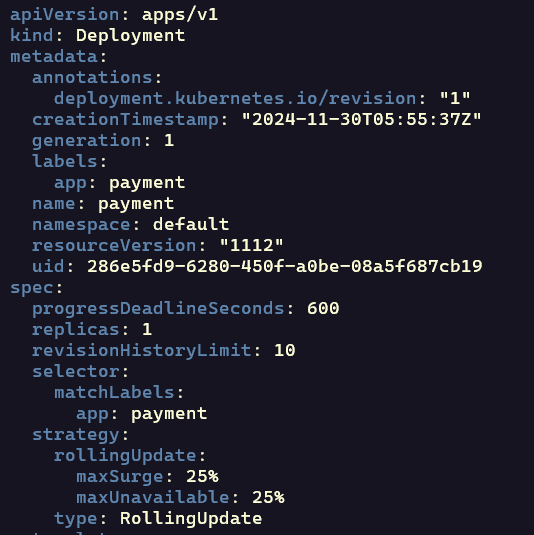
- Want to get the yaml output of the Kubernetes objects, just select the object and press
y.
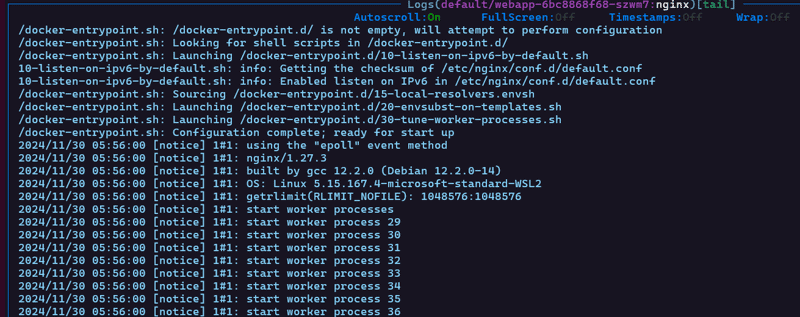
- Want to see the logs of a specific pod, select the pod and press
l.
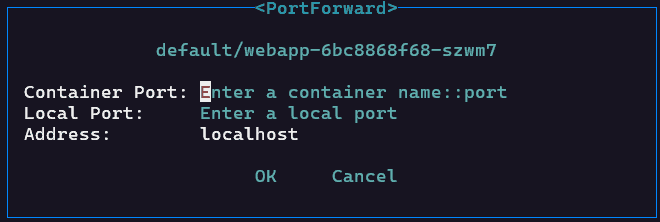
- You can even do port-forward from the same UI, isn’t it cool :), Just press
shift+fand if you want to see any existing port-forward are present or not, pressf.

- Sanitize/Clean up pods: For instance in below screen dump we can see there are 2 pods which are in
Completedand we want to clean them up.

Just press z, you will be asked “if you are sure”, type in “Yes Please!” and the job is done.

XRAY
Xray gives you a great detail in terms of co-relation between k8s objects, it basically provides a tree like structure.

Pulses
Pulses give a great dashboard to see what exactly is happening in your cluster, what all objects are there, health of your objects, etc?
NOTE: Make sure metrics-server is installed and running in the cluster otherwise you won’t see proper results. In my case it was not installed, therefore it was just stating blank results.

After installing metrics-server and launching pulses it shows an awesome dashboard.
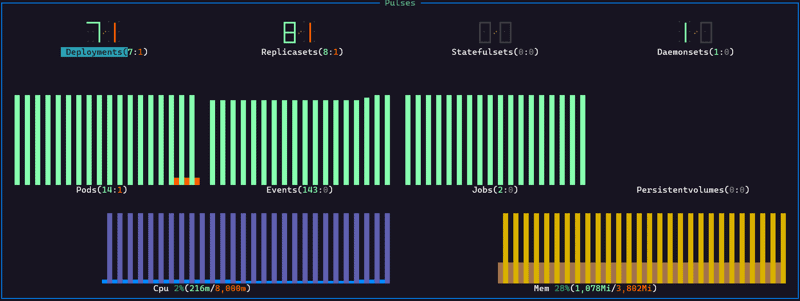
- The great part about it is, it shows the current status of your cluster.
- It even shows what all objects are healthy and what all objects are unhealthy.
- Legend: GREEN/HEALTHY & YELLOW/UNHEALTHY
References:
Feel free add your thoughts, Happy learning 🙂