Project post originally published on the OpenTelemetry blog by Drew Robbins (Microsoft), Liudmila Molkova (Microsoft)
As organizations increasingly adopt Large Language Models (LLMs) and other generative AI technologies, ensuring reliable performance, efficiency, and safety is essential to meet user expectations, optimize resource costs, and safeguard against unintended outputs. Effective observability for AI operations, behaviors, and outcomes can help meet these goals. OpenTelemetry is being enhanced to support these needs specifically for generative AI.
Two primary assets are in development to make this possible: Semantic Conventions and Instrumentation Libraries. The first instrumentation library targets the OpenAI Python API library.
Semantic Conventions establish standardized guidelines for how telemetry data is structured and collected across platforms, defining inputs, outputs, and operational details. For generative AI, these conventions streamline monitoring, troubleshooting, and optimizing AI models by standardizing attributes such as model parameters, response metadata, and token usage. This consistency supports better observability across tools, environments, and APIs, helping organizations track performance, cost, and safety with ease.
The Instrumentation Library is being developed within the OpenTelemetry Python Contrib under instrumentation-genai project to automate telemetry collection for generative AI applications. The first release is a Python library for instrumenting OpenAI client calls. This library captures spans and events, gathering essential data like model inputs, response metadata, and token usage in a structured format.
Key Signals for Generative AI
The Semantic Conventions for Generative AI focus on capturing insights into AI model behavior through three primary signals: Traces, Metrics, and Events.
Together, these signals provide a comprehensive monitoring framework, enabling better cost management, performance tuning, and request tracing.
Traces: Tracing Model Interactions
Traces track each model interaction’s lifecycle, covering input parameters (for example, temperature, top_p) and response details like token count or errors. They provide visibility into each request, aiding in identifying bottlenecks and analyzing the impact of settings on model output.
Metrics: Monitoring Usage and Performance
Metrics aggregate high-level indicators like request volume, latency, and token counts, essential for managing costs and performance. This data is particularly critical for API-dependent AI applications with rate limits and cost considerations.
Events: Capturing Detailed Interactions
Events log detailed moments during model execution, such as user prompts and model responses, providing a granular view of model interactions. These insights are invaluable for debugging and optimizing AI applications where unexpected behaviors may arise.
Note
Note that we decided to use events emitted with the Logs API specification in the Semantic Conventions for Generative AI. Events allows for us to define specific semantic conventions for the user prompts and model responses that we capture. This addition to the API is in development and considered unstable.
Extending Observability with Vendor-Specific Attributes
The Semantic Conventions also define vendor-specific attributes for platforms like OpenAI and Azure Inference API, ensuring telemetry captures both general and provider-specific details. This added flexibility supports multi-platform monitoring and in-depth insights.
Building the Python Instrumentation Library for OpenAI
This Python-based library for OpenTelemetry captures key telemetry signals for OpenAI models, providing developers with an out-of-the-box observability solution tailored to AI workloads. The library, hosted within the OpenTelemetry Python Contrib repository, automatically collects telemetry from OpenAI model interactions, including request and response metadata and token usage.
As generative AI applications grow, additional instrumentation libraries for other languages will follow, extending OpenTelemetry support across more tools and environments. The current library’s focus on OpenAI highlights its popularity and demand within AI development, making it a valuable initial implementation.
Example Usage
Here’s an example of using the OpenTelemetry Python library to monitor a generative AI application with the OpenAI client.
Install the OpenTelemetry dependencies:
pip install opentelemetry-distro
opentelemetry-bootstrap -a install
Set the following environment variables, updating the endpoint and protocol as appropriate:
OPENAI_API_KEY=<replace_with_your_openai_api_key>

OTEL_EXPORTER_OTLP_ENDPOINT=http://localhost:4318
OTEL_EXPORTER_OTLP_PROTOCOL=http/protobuf
OTEL_SERVICE_NAME=python-opentelemetry-openai
OTEL_LOGS_EXPORTER=otlp_proto_http
OTEL_PYTHON_LOGGING_AUTO_INSTRUMENTATION_ENABLED=true
# Set to false or remove to disable log events
OTEL_INSTRUMENTATION_GENAI_CAPTURE_MESSAGE_CONTENT=true
Then include the following code in your Python application:
import os
from openai import OpenAI

client = OpenAI()
chat_completion = client.chat.completions.create(
    model=os.getenv("CHAT_MODEL", "gpt-4o-mini"),
    messages=[
        {
            "role": "user",
            "content": "Write a short poem on OpenTelemetry.",
        },
    ],
)
print(chat_completion.choices[0].message.content)
And then run the example using opentelemetry-instrument:
opentelemetry-instrument python main.py
If you do not have a service running to collect telemetry, you can export to the console using the following:
opentelemetry-instrument --traces_exporter console --metrics_exporter console python main.py
There is a complete example available here.
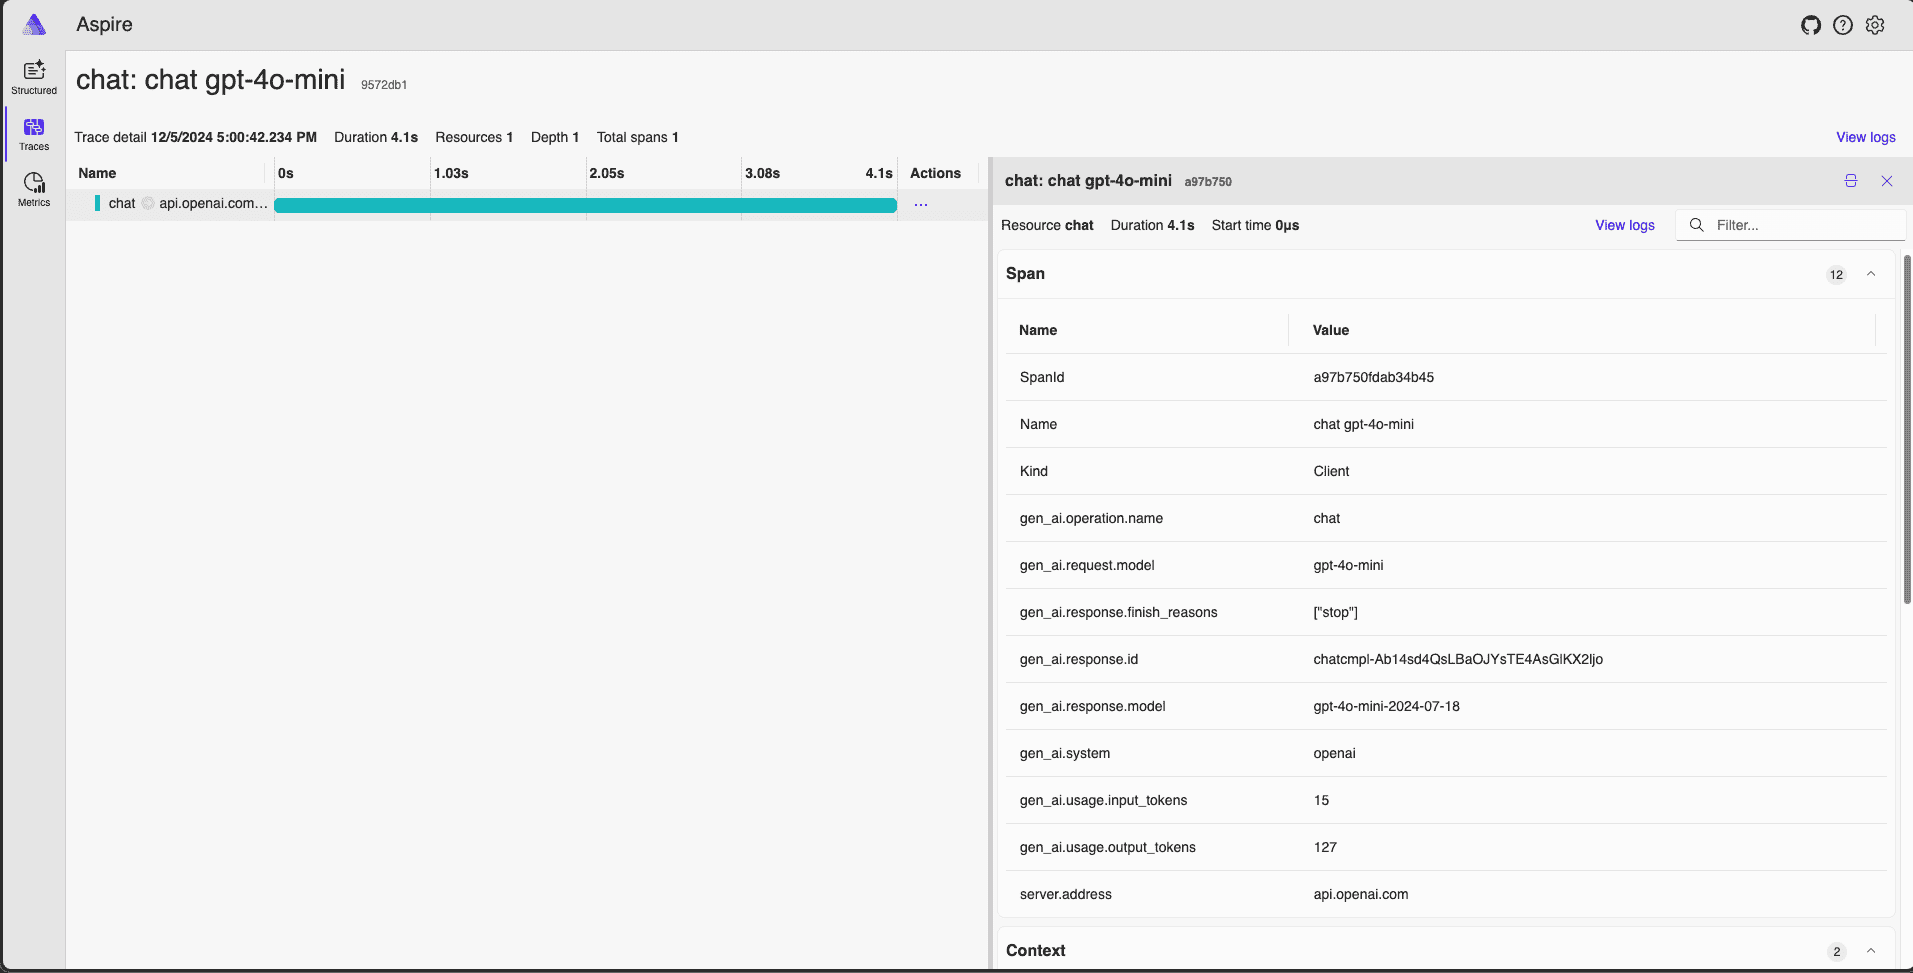
With this simple instrumentation, one can begin capture traces from their generative AI application. Here is an example from the Aspire Dashboard for local debugging.
To start Jaeger, run the following docker command and open your web browser the localhost:18888:
docker run --rm -it -d -p 18888:18888 -p 4317:18889 -p 4318:18890 --name aspire-dashboard mcr.microsoft.com/dotnet/aspire-dashboard:9.0

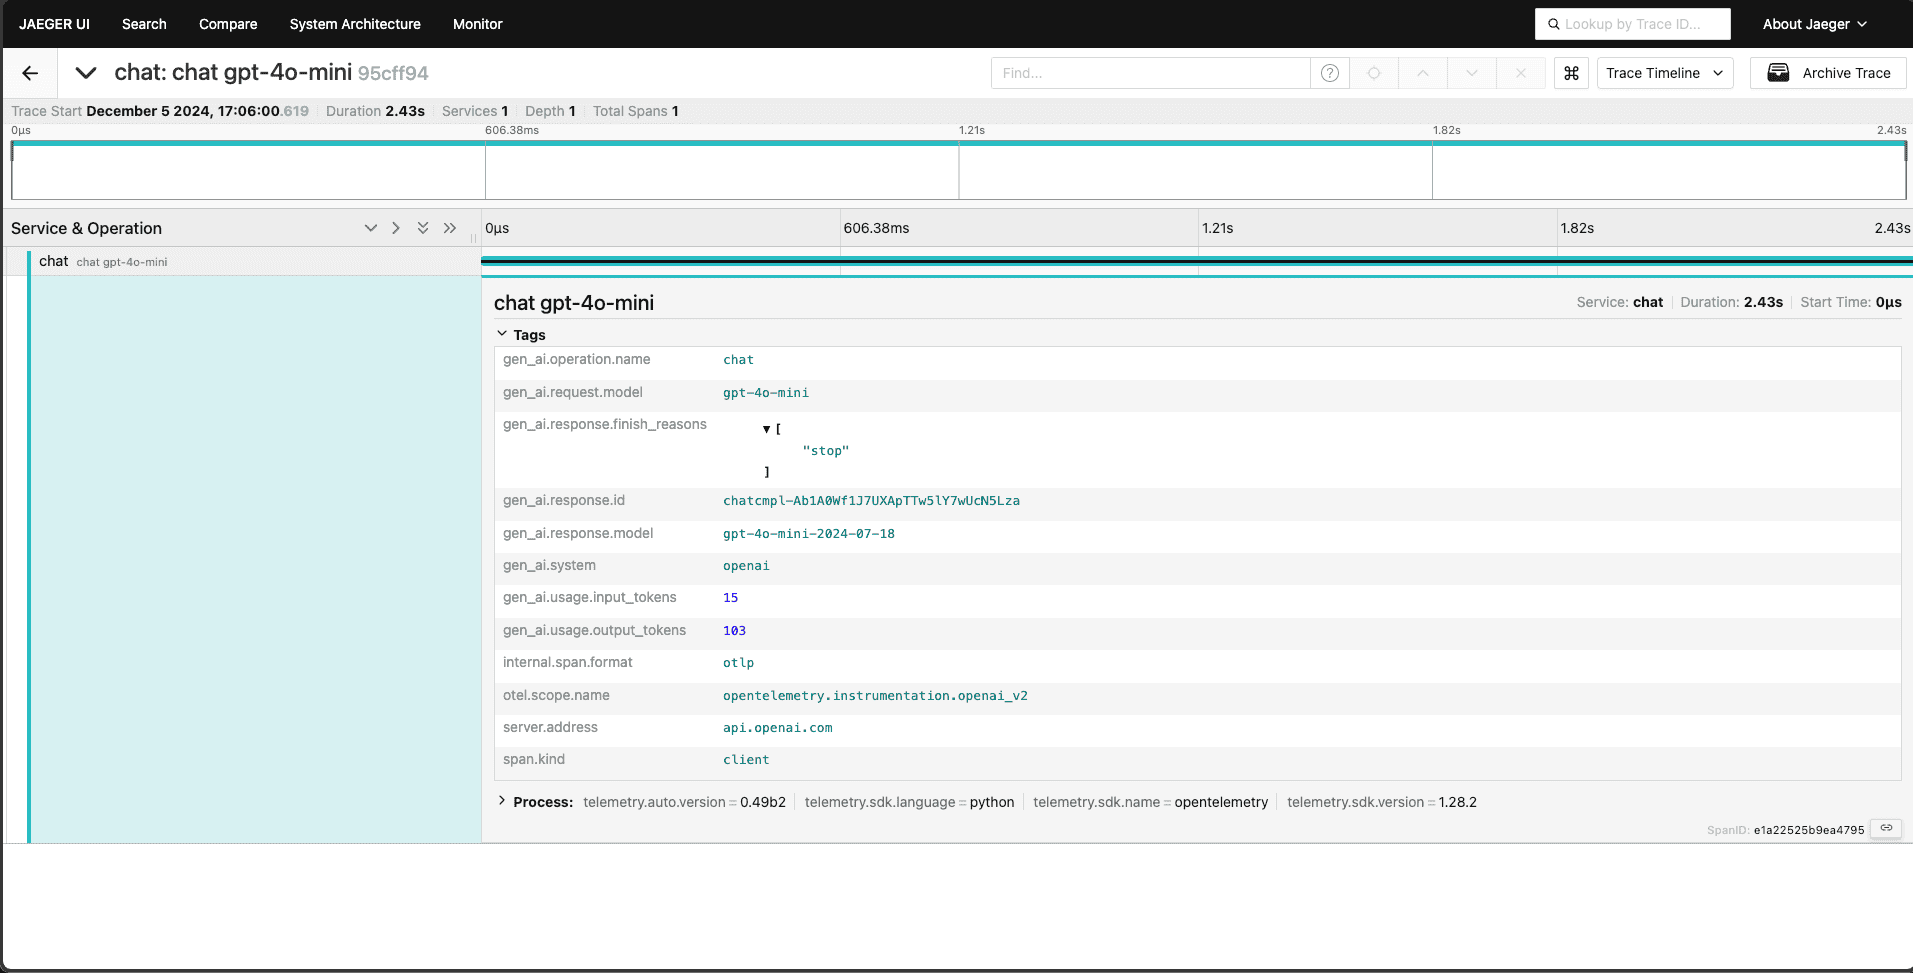
Here is a similar trace captured in Jaeger.
To start Jaeger, run the following docker command and open your web browser the localhost:16686.
docker run --rm -it -d -p 16686:16686 -p 4317:4317 -p 4318:4318 --name jaeger jaegertracing/all-in-one:latest

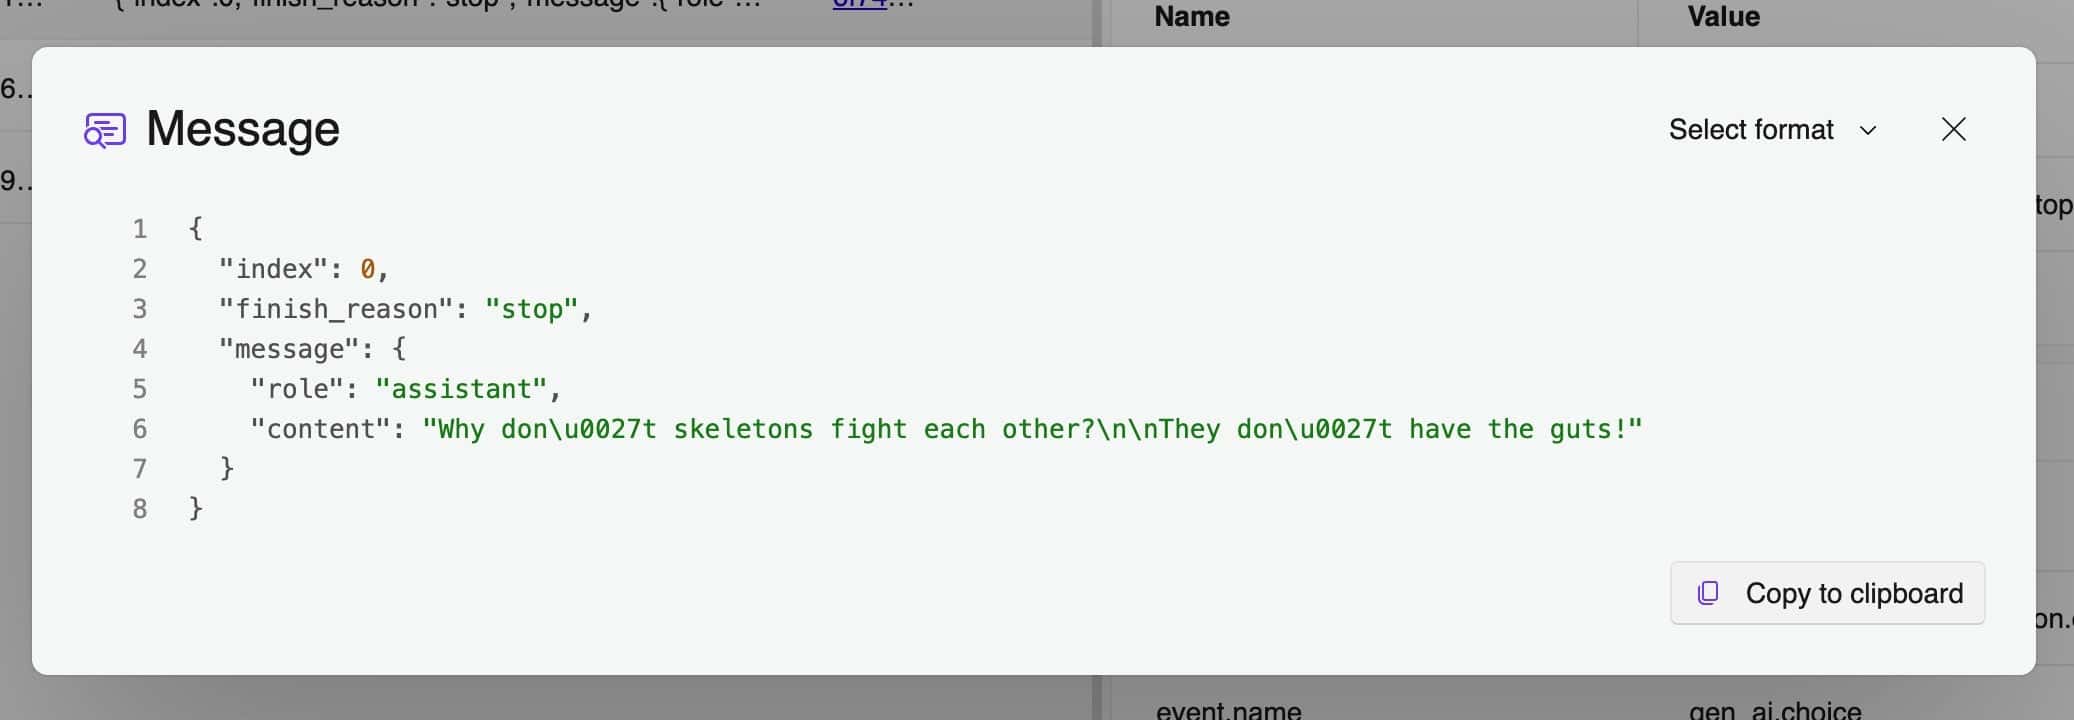
It’s also easy to capture the content history of the chat for debugging and improving your application. Simply set the environment variable OTEL_INSTRUMENTATION_GENAI_CAPTURE_MESSAGE_CONTENT as follows:
export OTEL_INSTRUMENTATION_GENAI_CAPTURE_MESSAGE_CONTENT=True
This will turn on content capture which collects OpenTelemetry events containing the payload:

Join Us in Shaping the Future of Generative AI Observability
Community collaboration is key to OpenTelemetry’s success. We invite developers, AI practitioners, and organizations to contribute, share feedback, or participate in discussions. Explore the OpenTelemetry Python Contrib project, contribute code, or help shape observability for AI as it continues to evolve.
We now have contributors from Amazon, Elastic, Google, IBM, Langtrace, Microsoft, OpenLIT, Scorecard, Traceloop, and more!
You are welcome to join the community! More information can be found at the Generative AI Observability project page.