
Strong identity and access management is a key component of a zero trust architecture for cloud native applications. Keycloak is well-known for its single-sign-on capabilities based on open standards. It provides you all the building blocks you need to run this in self-hosted environments on-premise and in the cloud. It lets you securely manage your users’ data, credentials and permissions, offers strong authentication, and acts as an integration hub for internal and external identity providers like Entra ID or Okta.
Keycloak release 26.2, released on April 11 2025, comes with the following highlights:
- Least-privileged delegated access for day-to-day operations without service desk tickets by delegating administrative tasks to application owners.
- Enhanced token-exchange for accurate and narrowly scoped tokens for zero trust architectures.
- Pre-defined Grafana dashboard to monitor service level indicators and key metrics of your self-hosted installations.
- Simplified update and configuration to increase availability, security-by-default and automation.
Read on to learn why these new release highlights are important, and how Keycloak delivers them.
Least-privileged delegated access for effective management
Fine-Grained Admin Permissions allow administrations to delegate administrative tasks to groups and individuals while complying with zero trust requirements and least privilege. This helps to reduce administrative costs and keep information up-to-date without service desk tickets, and enables organizations to scale and react faster to changes.
This supports setups like:
- Delegating administration of members of a group to an owner of the group.
- Delegating administration of a set of one or more clients in a realm to a person or a team that is managing the clients.
In Keycloak 26.2, this is now fully supported and no longer in preview. You can enable it on a per-realm basis. One of the major goals of the release was to improve the user experience as well as build an extensible framework to enable more fine-grained control over realm resources. There is now a dedicated section on the realm to manage permissions, and a form based UI to manage each permission. It also scales better for large setups with a lot of resources that need to be filtered.
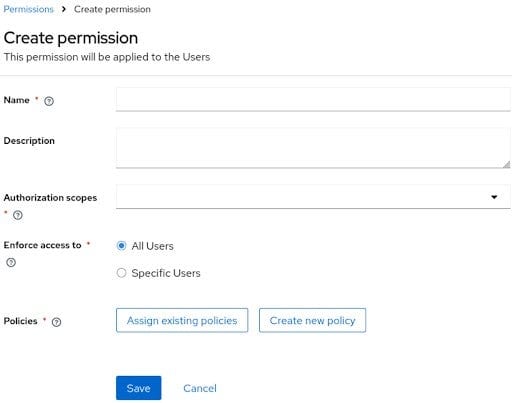
Read more about the permission model, scopes and resource type, see the Server Administration Guide for examples on how to set this up.
Token Exchange for accurately constrained tokens
The authorization to access resources is critical and delicate in a zero trust architecture. Key to the evaluation are tokens that are accurately scoped to both the application’s and the user’s context. In some scenarios, also the user’s consent that an application may access the data needs to be tracked.
The key to accurately scoped tokens is OAuth 2.0 Token Exchange, which has been standardized in the internet standard RFC 8693. Token exchange can be used in all scenarios where one application calls another application and needs to forward a token which is common in modern microservice architectures. To correctly assess the user’s and the calling application’s context, each application needs each token to have an explicit named audience, and neither too many nor too few scopes and permissions connected to it. A too small scope will not allow to satisfy the user’s needs, while a too broad scope would open the door to misuse or exfiltration of data.
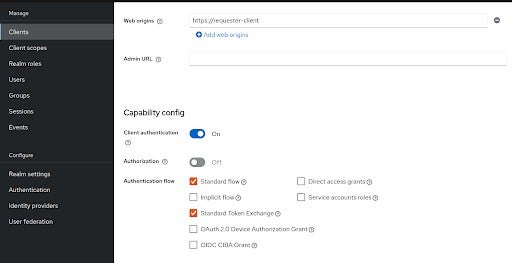
Token exchange for applications within your organisation’s realm is now fully supported. The process of which applications may exchange tokens is governed by Keycloak, including the revocation of tokens and keeping track of user consents.
We also improved the user interface to configure which applications can exchange tokens and for which scopes to better align with how other grant types are configured.
Effective management for self-hosted instances with Service Level Indicators
With Keycloak handling the authentication of users and applications in your application landscape, it is a critical part of your infrastructure. To avoid outages, you want to track its performance using service level indicators (SLIs).
For Keycloak 26.1, we published a guide on how to track the service level indicators availability, latency and error rate for instances of Keycloak, complete with example queries for Prometheus. They capture the performance of a system as perceived by end users. You can use these indicators to track your system’s performance on a day-to-day basis to identify system degradations, and track them against an internal target value which is then called service level objective (SLO). You can also use them to negotiate target values with your stakeholders which are then called service level agreements (SLA), or which are captured for DevOps scenarios as error budgets for both planned and unplanned maintenance.
In the latest release 26.2, we also ship a ready-to-use Grafana dashboard to track SLIs and other key metrics. Each key metric comes with extensive documentation on how to spot errors and remedies.
Logs, traces and metrics as the three pillars of observability
When analyzing incidents, the three observability pillars logs, traces and metrics guide you to the cause and allow you to find a remedy.
- Logs contain essential information about application behavior and security events.
Analyzing the logs helps admins to detect incidents and investigate attacks. While we supported structured logging with JSON and syslog for a long time, the latest version of Keycloak supports the ECS JSON format for logging, which will make it simpler to integrate Keycloak in an existing application landscape that relies on a common logging format.
- Traces connect a failure seen by a caller to its root cause like a flaky network connection to an external system.
They are available in the OpenTelemetry tracing format which has become a standard in industry with a wide support for tooling. For Keycloak, it allows you to trace all incoming requests and connect them to the triggered activities like database access, calls to external identity providers, or internal LDAP access, which speeds up a root-cause-analysis during an incident a lot.
- Metrics keep track of service level indicators and allow alerting and auto-scaling.
They track system and user activity, anything from the number of successful and failed logins to the utilization of caches and database connection pools. In Keycloak, they are available using the well-known Prometheus format and in the OpenMetrics format. In Keycloak 26.1, we published a full metrics and trouble shooting guide. New in 26.2 is the support for user event metrics which were in preview before. We now also support exemplars, which allow you to jump directly from an outlier metric or an error rate to a recorded trace that will guide you to the root cause of an error or an incurred latency.
Simplified update and configuration
Keycloak is now even simpler to upgrade and to configure for environments both inside and outside of Kubernetes.
- The Keycloak Operator now supports rolling updates for theme and provider updates to avoid downtimes. Our work continues to allow rolling updates also in other scenarios. The same functionality is also available for deployments not using the Operator.
- Keycloak clusters can now form automatically without the need to configure multicast or UDP, which was hard when deploying to cloud providers. Since Keycloak 26.1, Keycloak has been using its database to coordinate instances, and communicate between instances using TCP. New in 26.2 is that the encryption for the cluster communication is done automatically without additional steps required by an administrator.
- The Keycloak Operator now configures the matching Network policies in Kubernetes automatically to shield internal ports from unwanted traffic. Again one step less to configure for admins, and a better secure-by-default configuration.
Fast-forward to the next releases
Work for the next feature release, which is scheduled for June 2025, is already underway. Join our forum and slack channel to hear the latest news and contribute!