Prometheus is a widely-adopted open source metrics-based monitoring and alerting system. Initially developed at SoundCloud to solve end user needs, Prometheus is now hosted by the Cloud Native Computing Foundation (CNCF).
This report attempts to objectively assess the state of the Prometheus project and how CNCF has impacted the progress and growth of Prometheus. Of course, without access to a multiverse to play out alternative scenarios, it is impossible to sort out correlation and causation. However, this report can at least document correlations. This report is one of a series of project journey reports we will be publishing focused on graduated projects hosted by CNCF.
Project Snapshot
Prometheus’ first commit was made on November 24, 2012. Between joining CNCF on May 9, 2016 and today, Prometheus has added:
Note: These statistics were collected with the DevStats tool, which CNCF built in collaboration with CNCF project communities. Contributor is defined as somebody who made a review, comment, commit, or created PR or issue.
CNCF Premise of Open Source Software Development
A basic premise behind CNCF, our conferences (including KubeCon + CloudNativeCon and PromCon), and open source, in general, is that most interactions are positive-sum. There is no fixed amount of investment, mindshare, or development contributions that is allocated to specific projects.
Just as open source development is based on the idea that, collectively, we are smarter than any one of us, open source foundations work to make the entire community better off. Equally important, a neutral home for a project and community fosters this type of positive-sum thinking and drives growth and diversity that we believe are core elements of a successful open source project.
Code Diversity
While most of Prometheus’ initial development started at SoundCloud over seven years ago, the project today enjoys meaningful code contributions from more than 723 organizations, including hundreds of end users.
High-velocity open source projects like Prometheus garner wide adoption and contribution levels from both the vendor and end user communities. Prometheus code contributions come from a wide range of companies, fostering user-driven innovation.
Contributors to Prometheus include many of the world’s largest tech companies (Google, Amazon, Facebook, IBM, HPE, Lyft, Comcast, and Apple), as well as fast-growing mid-size companies (Spotify, Splunk, and Ticketmaster). Contributions also come from dozens of small businesses and startups (such as Kickstarter and the Wikimedia Foundation).
The diversity of vendor contributions is also expanding; Red Hat is now the third-largest contributor to Prometheus since project inception. Contributing organizations to Prometheus are well dispersed between vendors and end users, evidence that end-user innovation can foster and sustain fast-growing, successful projects.
Diversity Across Company Size and Type – by the numbers
The top two contributing companies as of the end of the September 2019 reporting period were SoundCloud and Robust Perception, with 21% and 18% of the code, respectively. SoundCloud and Boxever provided the majority of initial code contributions to the project over the first two years, but the Prometheus project has diversified to include many additional companies.
The total number of companies contributing code has increased by 258% since Prometheus joined CNCF, from 202 to 723. As SoundCloud’s percentage of all contributions has decreased, the gross number of contributions from Robust Perception and Red Hat has continued to expand. This indicates a healthy dynamic where the project originators continue to contribute high volumes of code but have also encouraged other organizations to contribute a greater percentage of code over time, sharing stewardship and growing the community. Another key health indicator is the number of contributors.
Prometheus has enjoyed an 825% expansion of individual contributors over the three years since the project joined CNCF. During the year before joining CNCF, Prometheus accumulated 691 contributors. In the two years since, Prometheus has added 6,395 contributors.
Geographic Diversity of Contributors
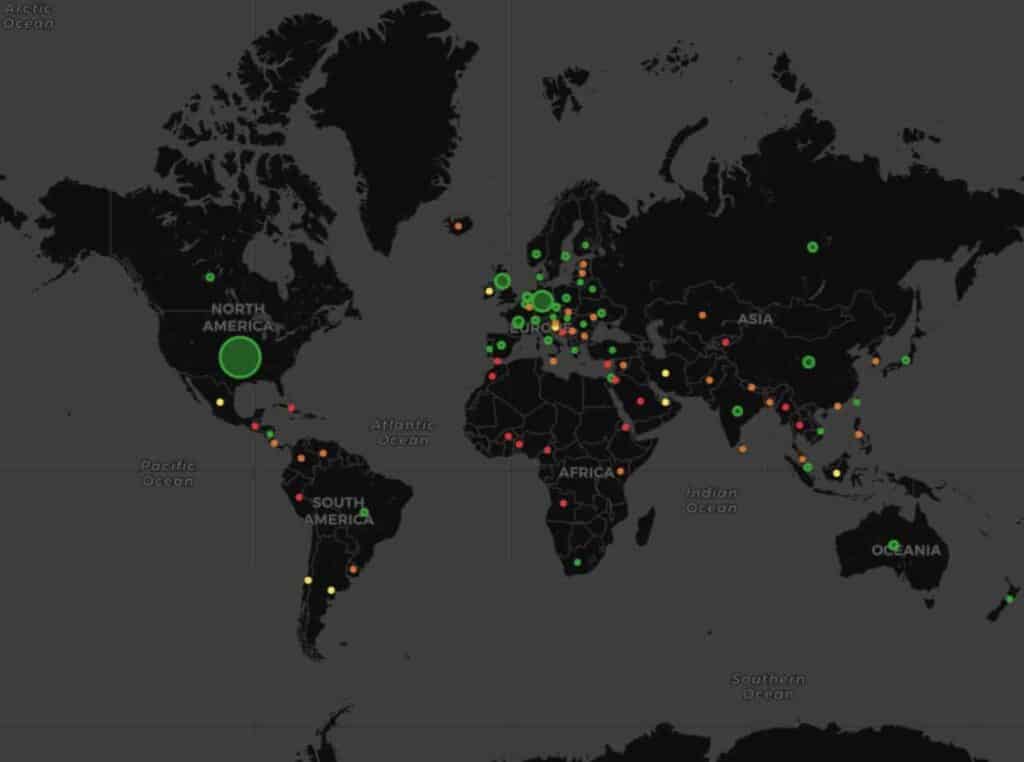
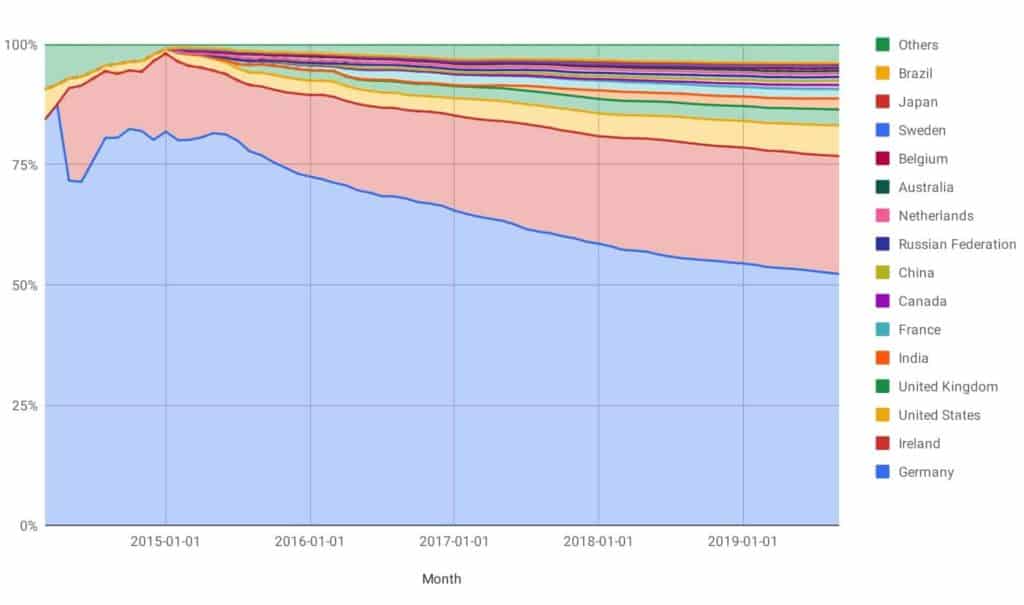
Contributors to Prometheus have come from more than two dozen countries spread across five continents since 2015.

The geographic diversity of contributions has expanded quickly from less than five countries in the first year of the project to roughly a dozen during the second year to a quarterly participation number fluctuating between 16 and 20 in year three.
These charts show the number percentage of contributors over time, broken down by country (based on self reported location on GitHub).

Development Velocity
Prometheus is growing quickly and is among the top three CNCF projects in terms of velocity.
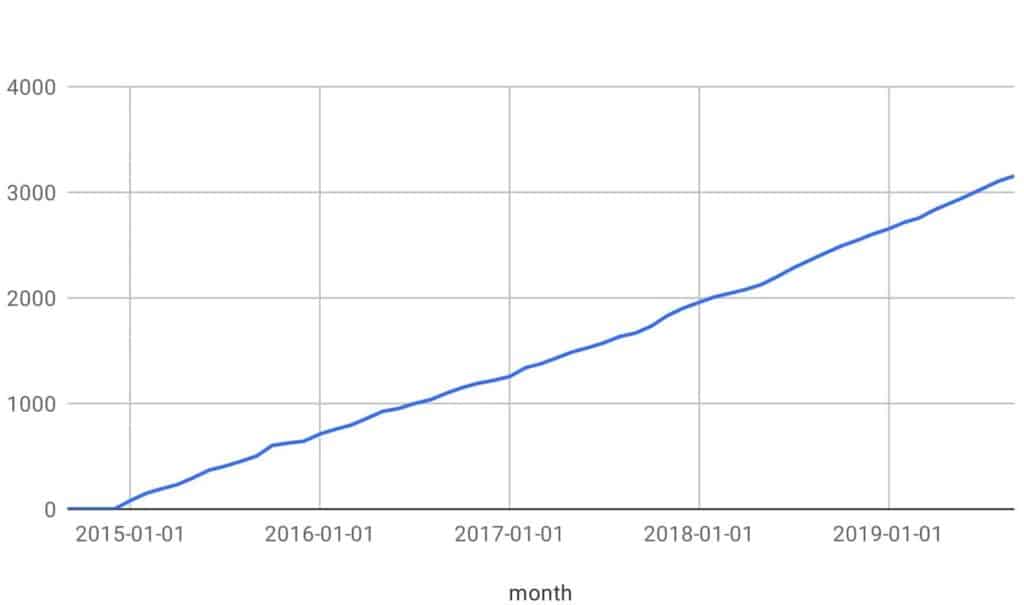
One way we track developer velocity is with the following formula: velocity = commits + PRs + issues + authors. We also look at the growth of PRs, code commits, and issues filed as separate line charts. A third way to examine is simply by looking at the cumulative number of contributors over time.
The charts below illustrate the constant and sharply rising velocity for Prometheus.
Education, Events and Sponsorship
Growth of community participation in education, events, and sponsorship are reliable proxies for the health of a project.

Prometheus is about to hold its fourth PromCon in Germany, each of which has reliably sold out with more than 200 attendees. CNCF has helped administer the events in 2017, 2018, and 2019, while the Prometheus maintainers retain responsibility for selecting the venue, managing the event experience, and making all content-related decisions. CNCF is working with the Prometheus maintainers to plan how the event should expand in the future to accommodate increased demand from the community, including for a North American event.
Marketing Growth and Programs
When Prometheus joined CNCF in May 2016, CNCF started promotional efforts to help sustain, nurture, and expand the Prometheus community.
This included blog posts, email newsletter mentions, and social media support. Thanks in part to these marketing efforts, public awareness of and interest in Prometheus have grown quickly. Google Analytics data for Prometheus shows a greater than 3x increase in pageviews since the project was contributed to CNCF in May 2016. Prometheus has also been covered as part of 7 different CNCF-hosted webinars and 32 end user case studies.
Project Documentation
Continuous additions to, and improvements of project documentation are essential for the growth of any open source project.
Robust documentation is critical to educating new users and to helping existing users resolve problems and understand a project’s capabilities. Prometheus documentation has rapidly expanded. Since joining CNCF, the number of authors and companies committing documentation to Prometheus has grown by 58.1% and 24.7%, respectively.
As of this report, over 623 authors have committed and over 252 companies are involved in committing documentation. The number of documentation commits has increased by 241% since Prometheus joined CNCF through the end of September 2019.
Note: Documentation for Prometheus is collected in .md files. CNCF uses the DevStats tool to automatically collect and count statistics of all relevant .md files in the Prometheus repositories in GitHub.

Conclusion
CNCF is committed to fostering and sustaining an ecosystem of open source, vendor-neutral projects by democratizing state-of-the-art patterns to make technology accessible for everyone.
We hope this report provides a useful portrait of how CNCF is fostering and sustaining the growth of Prometheus.
“When we started Prometheus in 2012 to solve our own monitoring challenges at SoundCloud, we would have never expected the project to spread throughout the world in the way that it has. Prometheus and its ecosystem have now become a de facto standard for metrics-based monitoring and alerting in the cloud native world and beyond. From small startups to large enterprises, all kinds of organizations world-wide are now betting on Prometheus for their critical systems and service monitoring. While the core of the project has become mature and stable, there is currently exciting work being done in the ecosystem around durable long-term storage integrations, better visualization of data, as well as further standardization of Prometheus-style metrics between vendors. I’m looking forward to seeing what the next years bring!”
– Julius Volz, Project Founder and Maintainer
“I feel incredibly honored to have had the chance to see the Prometheus community grow from when it was just a handful of people involved to the widely adopted project it is today. The community keeps surprising me in incredible ways, and I can honestly say that nothing in my career has been as rewarding as learning, collaborating and celebrating the success of not only the project itself, but also the greater ecosystem. I cannot wait to see where we can take the project next, but I know that with this passionate community it will certainly be something amazing.”
– Frederic Branczyk at Red Hat and Maintainer
“The collection, storage and presentation of time-series data was always overly complicated, until we utilized Prometheus. Scaling was simplified and client overhead was almost non-existent. We were able to replace a legacy reporting system with Prometheus while improving our performance and availability. Using custom tagging and Grafana we quickly went from theory to powerful dashboards which brought light to dark corners of our data center.”
– Ryan Ash, Technology Engineer at State Farm and End User